1. Introduction
The economic development and growth of human society result in increased water demand. The consequent problems of water pollution and water resource shortage have become challenges for humans [1–3]. Therefore, taking measures to promote wastewater reuse is necessary. On the one hand, it can effectively alleviate water pollution; on the other hand, it can improve water utilization and ease the current water shortage and other problems [4–6]. Most of the wastewater treatment modes are mixed collection and centralized treatments, thereby increasing the difficulty and cost of treatment; this scenario is unfavorable to wastewater reuse [7]. Thus, the source separation model for separate collection and treatment of wastewater is widely researched to overcome effectively the shortcomings of mixed collection and treatment [8–10].
Domestic sewage is divided into black water (toilet flushing sewage, including feces and urine) and greywater (without toilet flushing sewage) on the basis of different components, sources, and water characteristics [11]. Black water is further divided into yellow water (mainly urine) and brown water (mainly feces) [12]. Greywater takes up to 50−75% of the domestic wastewater volume produced by human activities [11, 13]. However greywater contains 30% organic pollutants and 9−20% inorganic pollutants, such as nitrogen and phosphorus. Therefore, greywater can be treated and reused easily using engineering applications. Greywater mainly contains grease, cooking oil, chemical dyes, soap residue, detergents and personal care products. Some studies have recently suggested that new contaminants, such as microplastics, drugs, and hormone-like substances, are found in greywater [14]. Many technologies are available for greywater treatment, and they are mainly divided into two categories: ecological treatment and biochemical treatment. At present, the commonly used technologies include purification tanks, biological filters, up-flow anaerobic sludge blankets, and membrane bioreactors (MBRs).
MBRs, which combine the activated sludge process and the membrane separation process, are widely used for wastewater treatment and reuse of reclaimed water because of their advantages, including compact size, good effluent quality, high sewage treatment efficiency, and easy-to-implement automatic control [15–18]. However, membrane fouling and the cost of membrane materials are the bottlenecks limiting the application of MBR technology [19]. Membrane fouling in MBRs is mainly due to the accumulation of particles, colloids, and solute macromolecules in the solution on the membrane surface, resulting in increased transmembrane pressure (TMP), decreased permeate flux, and poor separation performance [20, 21]. Recent studies suggested that the important factors in membrane fouling include operating conditions, biomass characteristics, and membrane characteristics [22]. Aeration flushing in MBRs is used to provide dissolved oxygen (DO) in the activated sludge and mitigate membrane fouling effectively [23]. However, aeration intensity exceeding the critical value aggravates membrane fouling while wasting electricity and increasing costs [24]. Aeration mode effects extracellular polymeric substance (EPS), soluble microbial product (SMP), sludge particle size distribution (PSD), and other indicators in the sludge mixture.
Hollow-fiber and flat-sheet organic membrane modules are widely used in wastewater treatment. In this study, self-designed integrated hollow-fiber and flat-sheet organic MBRs were investigated for rural greywater treatment and reuse. The aeration energy consumption accounts for a relatively high share of MBR operating costs; however, the mechanism of aeration in the removal of pollutants and membrane fouling in greywater treated by MBRs have a little been reported. Therefore, the effects of aeration modes on MBRs for greywater reuse and treatment and membrane fouling were investigated herein.
The MBR aeration mode was optimized by comparing the changes in SMP, EPS, and sludge particle sizes in the reactor mixture, efficiency of pollutant removal from wastewater, and membrane permeability for two MBRs under different aeration modes. A scanning electron microscope (SEM) coupled with a mapping analytical energy-dispersive X-ray spectroscope (EDS) and three-dimensional excitation-emission matrix (EEM) were used to analyze the morphology and material composition of the fouled membrane surface to examine the causes of membrane fouling. The effect of the microbial community on membrane fouling was revealed by the community analysis of a sludge mixture and filter cake layer in MBRs based on high-throughput 16S rRNA gene sequencing. The changes in wastewater treatment effect, membrane permeability performance, and causes of membrane fouling under different aeration modes for two MBRs were investigated. Essential data and theoretical guidance are provided for the development of operation modes with effective and low-energy operation modes of MBRs and the regeneration and reuse of greywater.
2. Material and Methods
2.1. Experiment Materials
In this study, two different types of membrane modules were used: hollow fiber membrane (KAIMI, Jiangsu Province, China) and flat sheet organic membrane (PEIER, Jiangsu Province, China). Fig. S1(a) shows the hollow-fiber membrane module, whereas Fig. S1(b) shows the flat-sheet organic membrane module. Table S1 lists the physical and chemical properties of each membrane. Both membranes were externally pressed with a nonwoven polyethylene terephthalate liner. The total effective filtration area of the hollow fiber membrane module and the flat sheet organic membrane module was 0.063 m2 and 0.1008 m2, respectively.
In this study, the influent greywater of the MBRs was manually synthesized following the literature [25, 26]. Table S2 lists the synthetic greywater composition. The greywater qualities and characteristics are shown in Table S3. The activated sludge was taken from the Nanjing Qiaobei Sewage Treatment Plant. The activated sludge was incubated and domesticated for 2 weeks before being placed into the MBRs.
2.2. Experiment Device and Operation
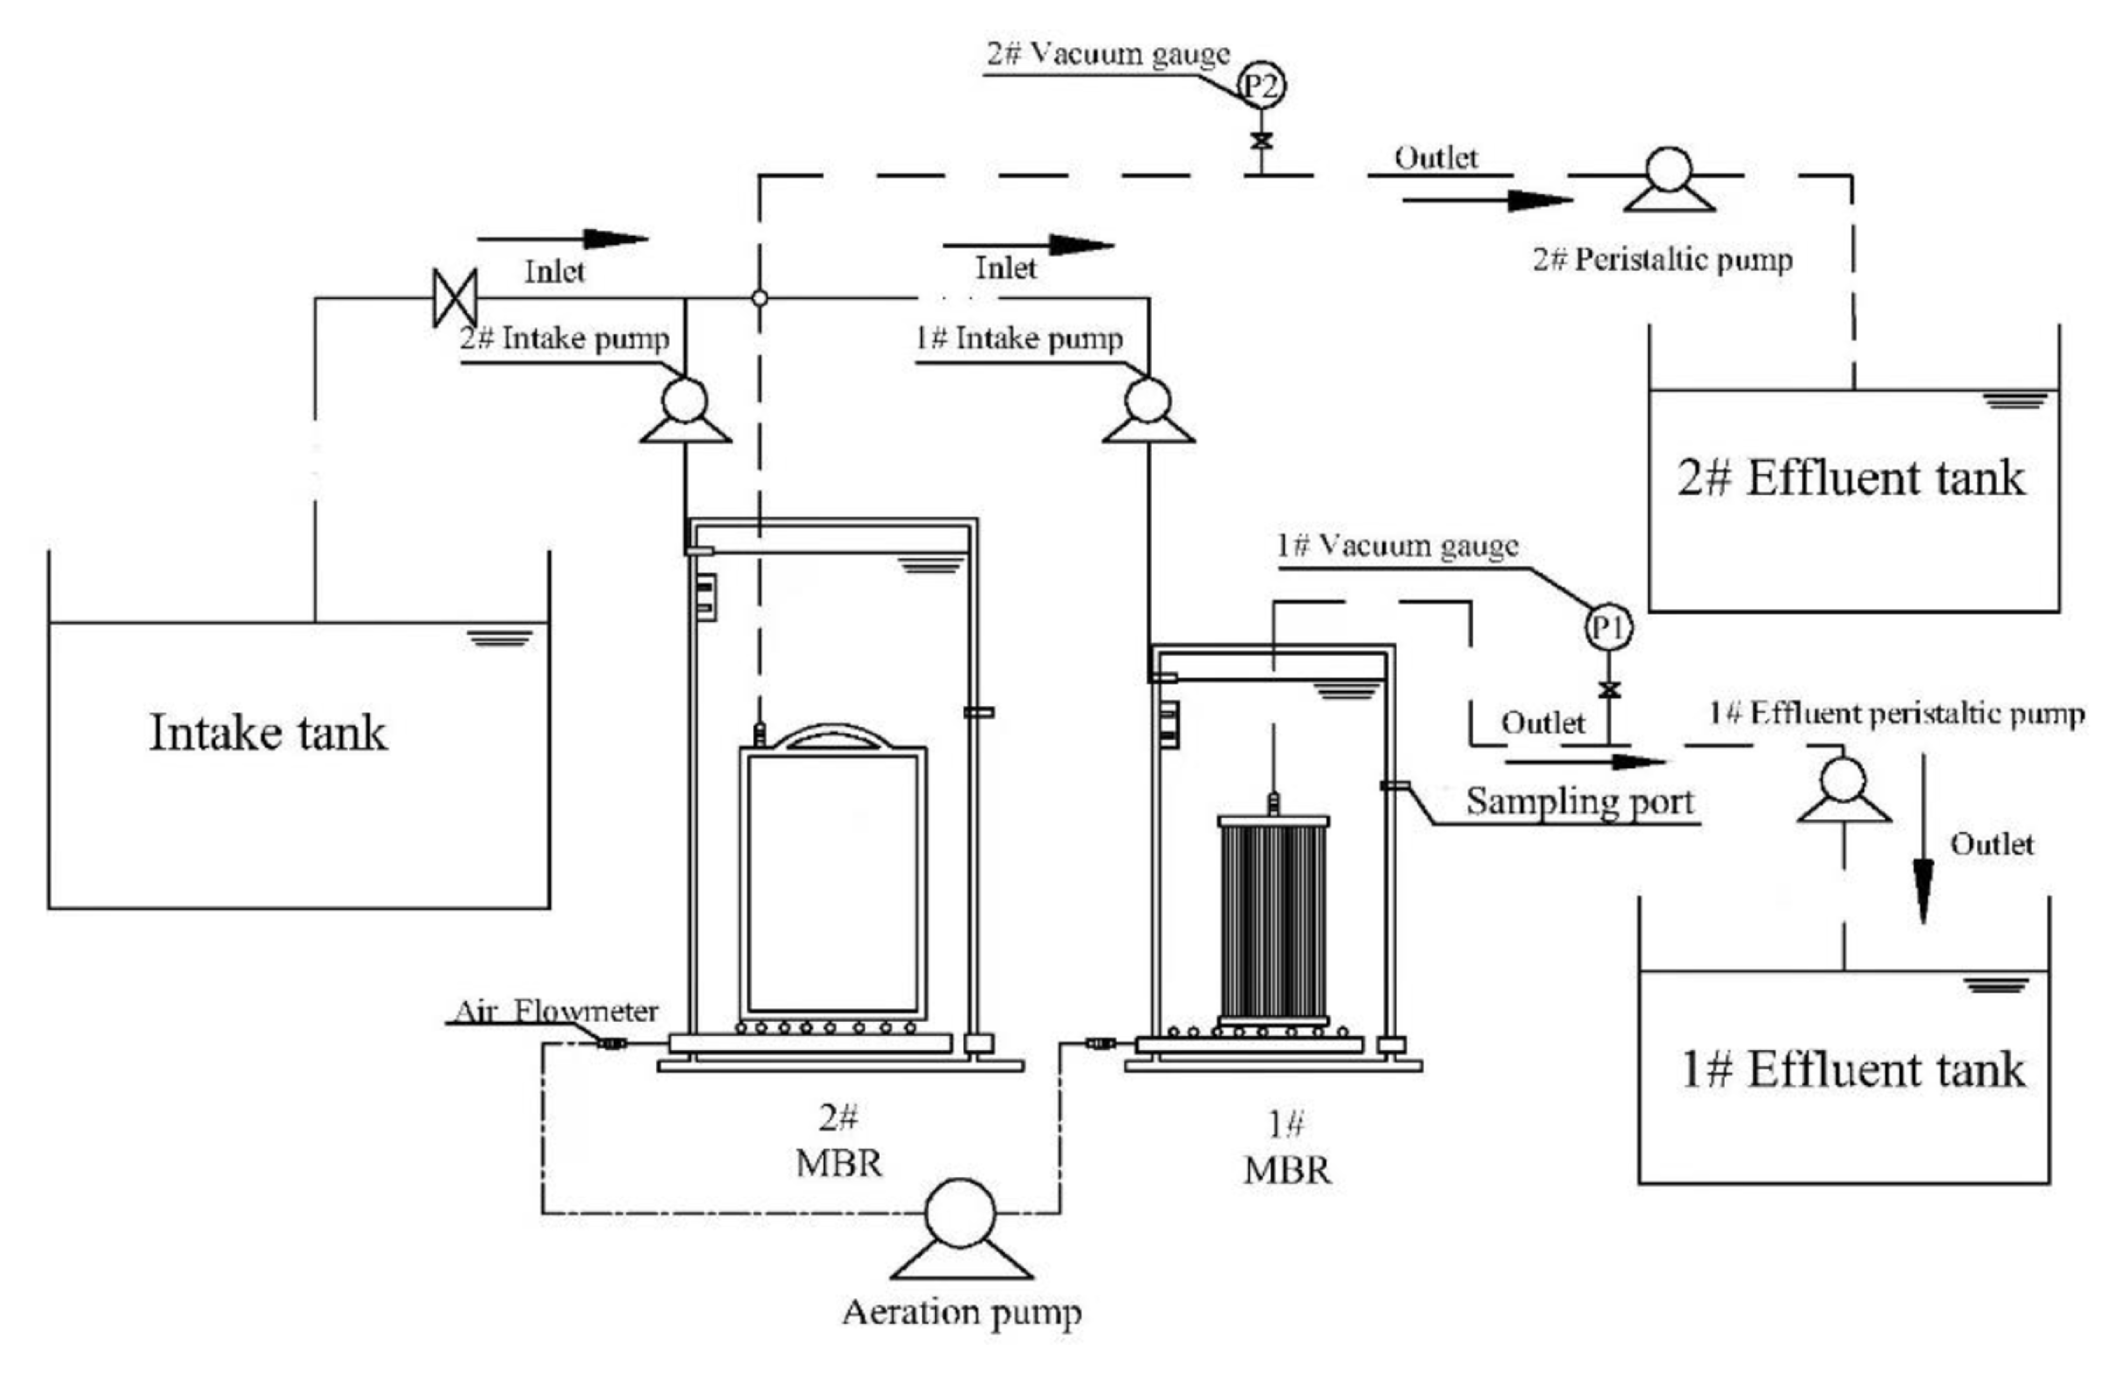
The laboratory schematic of MBRs used in this study is shown in Fig. 1. The hollow fiber MBR and the flat sheet MBR are denoted as 1#MBR and 2#MBR. The effective total volume of the membrane tanks for 1#MBR and 2#MBR is 12 L and 21 L, respectively. A blower provided the two MBRs with air. The aeration rate was controlled by the flowmeter. The aeration at the two MBR aeration tanks was maintained at different aeration modes by using a programmable logic controller. In each reactor, the membrane module was connected to a magnetic drive gear pump (Ouruike, Nanjing, China), and the effluent water was achieved by the suction force generated by the pump. The intake tank was connected to the membrane tank, and the inlet water was achieved through a peristaltic pump (Kamoer, Shanghai, China). TMP was measured periodically with a digital pressure gauge (Asmik, Hangzhou, China).
The MBRs flux was calculated as the weight of effluent collected from each system, divided by the specific weight, by the filtration period, and by the area of the membrane, as shown Eq. (1) [27]. Table 1 lists the operation conditions of the experiment on the seven phases of aeration conditions of different aeration mode in the MBRs. The MBRs were operated in continuous influent and continuous effluent modes, with a hydraulic retention time of 6–8 h and a daily production time of 8h. The rest of the time, the MBRs didn’t produce water, whereas spent in aeration to the reactor to maintain the growth of microorganisms. The beginning of the MBRs’ operation flux was below the critical fluxes at 34 (1#MBR) and 30L/m2.h (2#MBR). At the end of each operation phase, fouled membrane modules were cleaned by soaking in 0.1% NaClO solution for 5 h and rinsing with pure water to restore the initial flux. In particular, the membranes of the MBRs used in each phase were cleaned. The original conditions of the operation systems, activated sludge concentration, and influent water quality were consistent. The effects of effluent quality and membrane fouling on the MBRs were studied under the different working conditions mentioned above.
2.3. Analysis Methods
2.3.1. DO and water quality index analysis
The DO concentrations in MBRs were measured with electrodes (hqd-LDO, HACH, America) every day based on different operation phases. The concentration of chemical oxygen demand (COD) in the influent and effluent water was determined through dichromate method. The concentration of total nitrogen (TN) in the influent and effluent water was determined via alkaline potassium persulfate digestion UV spectrophotometric method (T6S, Persee, China). The concentration of ammonia nitrogen (NH4+-N) in the influent and effluent water was determined through Nessler’s reagent spectrophotometry. The concentration of total phosphorus (TP) in the influent and effluent water was determined via the ammonium molybdate spectrophotometric method.
2.3.2. Analysis of the sludge characteristic
The PSD of the mixture sludge was measure with Mastersizer 2000 (Malvern Instruments, Hydro 2000 MU) to study the hydrodynamic shear based on different aeration rates and the effects on the breakup of activated sludge flocs. In this study, the EPS extraction from activated sludge was obtained using a cation exchange resin [28]. Then, the 10 mL sample of activated sludge was withdraw from 1# MBR and 2# MBR. It was placed in a 50 mL centrifuge tube and centrifuged at 4°C and 3,000 g (RCF) for 10 min. The supernatant was removed, and PBS buffer solution was added. After being shaken for 1min in a vortex shaker, the sample was centrifuged for 10 min at 4°C and 3,000 g. The procedure was repeated 2–3 times to remove the unnecessary components in the muddy water mixture. The centrifuged sludge was removed and recalculated at 50 mL. A certain amount of cation exchange resin (2.9 g for 1# MBR sample and 2.6 g for 2# MBR sample) was weighed, added to a 100 mL triangular flask together with the mud-water mixture, and shaken at 4°C for 12 h at a speed of 200 r/min. The supernatant was filtered through a 0.45μm membrane and stored in a refrigerator at 4°C. The supernatant was removed and centrifuged (4°C, 11,000 g) for half an hour, and the procedure was repeated twice. In this research, the SMP extraction from activated sludge was achieved through a high-speed centrifugal method [29]. The SMP was extracted by centrifuging for 10 min at 5,000 g to remove the sludge and filtered through a 0.22 μm filter membrane. The supernatant, which contained the SMP, was extracted and stored in the fridge for later analysis. The results of some studies indicated that the main components of the SMP and EPS are proteins and polysaccharides [30–32]. Using the modified Lowry protein assay kit as the standard (Sangon Biotech, Shanghai, China) for proteins determination, and using the phenol-sulphuric acid method with glucose as the standard [33] for carbohydrates determination. Because EPS and SMP are organic matter which have direct relationship to TOC, therefore, as a reference, the TOC (TOC-L, Shimadzu, Japan) were measured by an automatic total organic carbon analyzer to describe the changes of SMP and EPS in this study.
2.3.3. Analysis of membrane permeability and fouling
Based on flux and TMP across the membrane, Eq. (2) is used to evaluate membrane permeability characteristics in different operating conditions.
J is the 6 min flux of the filtration (L/m2·h), and Δp is the amount of change in TMP (Kpa), which corresponds to every 6 min of operation.
The three-dimensional EEM (FL-7000, Hitachi, Japan) was used to measure the sludge mixture and the filter cake layer of the polluted membrane. Emission scans were performed from 220 to 550 nm at 5 nm steps, with excitation wavelengths from 220 nm to 450 nm at 5 nm intervals. Before the microscope test, the polluted membrane was freeze-dried and coated with gold. The morphology and main elements of the cake and concentrate particles of the polluted membrane were measured using a ZEISS Sigma-300 SEM coupled with a mapping analytical EDS.
2.3.4. Determination and analysis of the microbial composition
Four samples from the sludge mixture and membrane filter cake layer of 1#MBR and 2#MBR were determined and analyzed for microbial composition. The MBRHa sample was collected from the sludge mixture, whereas the MBRHb sample was collected from the membrane filter cake layer of 1#MBR. The MBRFa sample was collected from the sludge mixture, whereas the MBRFb sample was collected from the membrane filter cake layer of 2#MBR.
The microbial community genomic DNA was extracted from the abovementioned samples using the E.Z.N.A.® soil DNA Kit (Omega Bio-tek, Norcross, GA, U.S.) according to manufacturer’s instructions. The DNA extract was checked on 1% agarose gel, and DNA concentration and purity were determined with Nano Drop 2000 UV-vis spectrophotometer (Thermo Scientific, Wilmington, USA). The hypervariable region V1-V3 of the bacterial 16S rRNA gene were amplified with primer pairs 27F(5′-AGAGTTTGATCCT GGCTCAG-3′)and 533R(5′-TTACCGCGGCTGCTG-GCA-3′) using the ABI GeneAmp®9700PCR thermocycler (ABI, CA, USA) [34]. The PCR amplification of 16S rRNA gene was performed as follows: initial denaturation at 95°C for 3 min, 30 cycles of denaturing at 95°C for 30 s, annealing at 55°C for 30 s, extension at 72°C for 45 s, single extension at 72°C for 10 min, and end at 10°C. The PCR mixtures contain 5 × Trans Start FastPfu buffer 4 μL, 2.5 mM dNTPs 2 μL, forward primer (5 μM) 0.8 μL, reverse primer (5 μM) 0.8 μL, Trans Start FastPfu DNA Polymerase 0.4 μL, template DNA 10 ng, and up to 20μL ddH2O. PCR reactions were performed in triplicate. The PCR product was extracted from 2% agarose gel and purified using the AxyPrep DNA Gel Extraction Kit (Axygen Biosciences, Union City, CA, USA) according to manufacturer’s instructions and quantified using Quantus™ Fluorometer (Promega, USA). Purified amplicons were pooled in equimolar and paired-end sequenced (2 × 300) on an Illumina MiSeq platform (Illumina, San Diego, USA) according to the standard protocols by Majorbio Bio-Pharm Technology Co. Ltd. (Majorbio, Shanghai, China).
3. Results and Discussion
3.1. Change in DO and Effect of Different Aeration Modes on Pollutant Removal Efficiency in the MBRs
Fig. S2 (a) and (b) demonstrate the DO concentrations in 1#MBR and 2# MBR, respectively, based on different aeration modes. At the continuous aeration mode, the average DO concentrations in the 1#MBR are 3.22 mg/L (Phase 1), 4.51 mg/L (Phase 2), 5.57 mg/L (Phase 3), and 6.43 mg/L (Phase 4). At the same aeration mode, the average DO concentrations in the 2#MBR are 3.58 mg/L (Phase 1), 3.43 mg/L (Phase 2), 4.46 mg/L (Phase 3), and 5.34 mg/L (Phase 4). At the intermittent aeration mode, the average DO concentrations in the 1#MBR are 5.26 mg/L (Phase A), 4.57 mg/L (Phase B), and 2.11 mg/L (Phase C), whereas the average DO concentrations in the 2#MBR are 4.61 mg/L (Phase A), 2.54 mg/L (Phase B), and 1.88 mg/L (Phase C). These findings indicated that in the continuous aeration mode, the increase of aeration rate increases the DO concentrations in the 1#MBR and 2#MBR. In the intermittent aeration mode, the increase of the aeration stop ratio decreases the DO concentrations in the 1#MBR and 2# MBR.
The COD, NH4+-N, TN, and TP concentrations and the removal rate of the inlet and outlet water were analyzed every day to explore the efficiency of water treatment in MBRs with different aeration modes. The results are shown in Fig. 2. As shown in Fig. 2(a) and (b), the MBRs showed good removal performances of COD and NH4+-N from greywater based on the continuous aeration mode and intermittent aeration mode. In continuous aeration mode, the average removal rates of COD are 92.1% (1#MBR) and 90.5% (2#MBR), and the influent COD concentrations range from 309 (mg/L) to 378 (mg/L). Hence, the average effluent concentrations are lower than 50 (mg/L) based on the continuous aeration mode. In intermittent aeration mode, the average removal rates of COD are 94.7% (1#MBR) and 94.2% (2#MBR), and the influent COD concentrations range from 302 to 401 mg/L. Hence, the average effluent concentrations are lower than 50 (mg/L). This scenario is attributed to the sufficient oxygen supply favorable for the growth of microorganisms and meeting of heterotrophic bacteria [35]. In continuous aeration mode, the average influent NH4+-N concentrations range from 10.3 mg/L to 16.4 mg/L (1#MBR and 2#MBR). The average effluent concentrations are 1.52 mg/L (1#MBR) and 2.45 mg/L (2#MBR). The average removal rates of NH4+-N are 88.9 (1#MBR) and 84.8% (2#MBR) based on the continuous aeration mode. In the intermittent aeration mode, the average removal rates of NH4+-N are 88.0% (1#MBR) and 88.9% (2#MBR). The average influent NH4+-N concentrations range from 17.2 mg/L to 25.6 mg/L. The average effluent concentrations are 2.59 mg/L (1#MBR) and 2.32 mg/L (2#MBR) based on the intermittent aeration mode. These findings indicated that intermittent aeration mode does not affect the NH4+-N removal efficiency [36]. The effluent of COD and NH4+-N concentrations based on continuous and intermittent aeration modes can reach the required “Discharge standard of pollutants for municipal wastewater treatment plant”(GB 18918-2002) [37]. This scenario is attributed to the DO concentrations in MBRs based on different aeration modes suitable for the activity and proliferation rate of nitrifying bacteria [38]. As shown in Figs. 2(c) and 2(d), the removal performances of TP and TN from greywater based on the intermittent aeration mode are higher than those based on the continuous aeration mode in the MBRs. In the continuous aeration mode of MBRs, the average removal rates of TN are 40.98% (1#MBR) and 36.68% (2#MBR). The average influent TN concentration is 31.06 mg/L (1#MBR and 2#MBR); the average effluent TN concentrations are 18.30 mg/L (1#MBR) and 19.62 mg/L (2#MBR). The average removal rates of TP are 33.13% (1#MBR) and 35.73% (2#MBR). The average influent TP concentration is 2.87 mg/L (1#MBR and 2#MBR); the average effluent TP concentrations are 1.97 mg/L (1#MBR) and 1.88 mg/L (2#MBR). In the intermittent aeration mode, the average removal rates of TN are 47.12% (1#MBR) and 48.22% (2#MBR). The average influent TN concentration is 23.72 mg/L (1#MBR and 2#MBR);the average effluent TN concentrations are 12.65 mg/L (1#MBR) and 12.45 mg/L (2#MBR). The average removal rates of TP are 53.27% (1#MBR) and 53.07% (2#MBR). The average influent TP concentration is 3.66 mg/L (1#MBR and 2#MBR);the average effluent TP concentrations are 1.70 mg/L (1#MBR) and 1.80 mg/L (2#MBR). However, the effluent of TN and TP concentrations based on continuous and intermittent aeration modes both couldn’t reach the required “Discharge standard of pollutants for municipal wastewater treatment plant”(GB 18918-2002) [37]. This phenomenon is consistent with previously published by several research [39, 40].
The TN and TP concentrations in effluent water can reach the standard by combining other processes. The removal of TN is mainly due to the conversion of nitrogenous compounds into N2 via ammoniation, nitrification, and denitrification of microorganisms [41]. The removal of TP is carried out by phosphorus accumulating organisms(PAOs), which absorb dissolved phosphorus, store it in their body, and discharge it with the remaining sludge [42]. In this research, the poor TN removal in the continuous aeration mode was observed because the anaerobic environment required for denitrification bacteria cannot be satisfied. Moreover, the average DO concentration in the continuous aeration mode is higher than that in the intermittent aeration mode. In the intermittent aeration mode, the oxygen diffusion is limited. Thus, the DO gradient in the floc body improves the nitrification and denitrification efficiency. The intermittent aeration mode environment is suitable for the growth of denitrifying bacteria, thereby improving the removal rate of TN. Likewise, intermittent aeration mode can provide an anaerobic/aerobic environment that is good for the growth and reproduction of various microorganisms. However, the growth environment (excessive phosphorous uptake under aerobic conditions/phosphorus released under anaerobic conditions) for PAOs is destroyed in the continuous aeration mode [43]. Therefore, the intermittent aeration mode is better than continuous aeration mode in improving phosphorus removal.
Fig. 4(a) to (d) show that the removal rates of COD, NH4+-N, TN, and TP in the 1#MBR and 2#MBR generally demonstrate similar trends based on the same operation conditions. The cultivation and obtain of activated sludge and the membrane materials characteristics in the different MBRs are consistent, whereas the membrane modules are irregular. While the removed rate of COD, NH4+-N of MBRs were almost no significant different at the two MBRs. The efficiency of MBRs in removing pollutants from wastewater is mainly related to the activity of microorganisms, the aeration mode of operation. The efficiency of two MBRs in removing pollutants from wastewater isn’t related to the type of membrane modules. The effluent water quality of MBRs is good, and the treatment efficiency of nitrogen and phosphorus is high based on the intermittent aeration mode; these findings are similar to those of other studies [44, 45]. Moreover, the main effluent water quality indicators of MBRs could reach the required “water-Water quality standard for urban miscellaneous use”(GB/T 18920–2020) [46] and “Standards for irrigation water quality”(GB 5084–2005) [47]. The effluent water quality could be reused in urban and irrigation by both MBRs.
3.2. Effect of Different Aeration Modes on Sludge Characteristics during Operation
Fig. S3(a) and (b) show the PSD of 1#MBR and 2#MBR sludge with different aeration rates of continuous aeration mode. In Fig. S3(a), the PSD has four peak sizes (58, 60, 70, and 71 μm) with aeration rates of 7, 9, 5, and 3 L/min. In Fig. S3(b), the PSD has four peak sizes (62, 64, 70.9, and 70.9 μm) with aeration rates of 7, 9, 5, and 3 L/min. The increase of the aeration rate shifts the sludge size distribution peak to the left. The changes of the PSD clearly demonstrate the destruction of shear force from the high aeration rate.
Figs. S3(c) and (d) show the PSD of 1#MBR and 2#MBR sludge with different aeration stop ratios at the intermittent aeration mode. In Fig. S3(c), the PSD has three peak sizes (56.1, 56.3, and 56.4 μm) with the aeration stop ratios of 15/5, 15/10, and 15/15 (min). In Fig. 5(d), the PSD has three peak sizes (70.9, 70.0, and 63.2 μm) with the aeration stop ratios of 15/5, 15/10, and 15/15 (min). The different aeration stop ratios in the intermittent aeration mode slightly affect the activated sludge PSD.
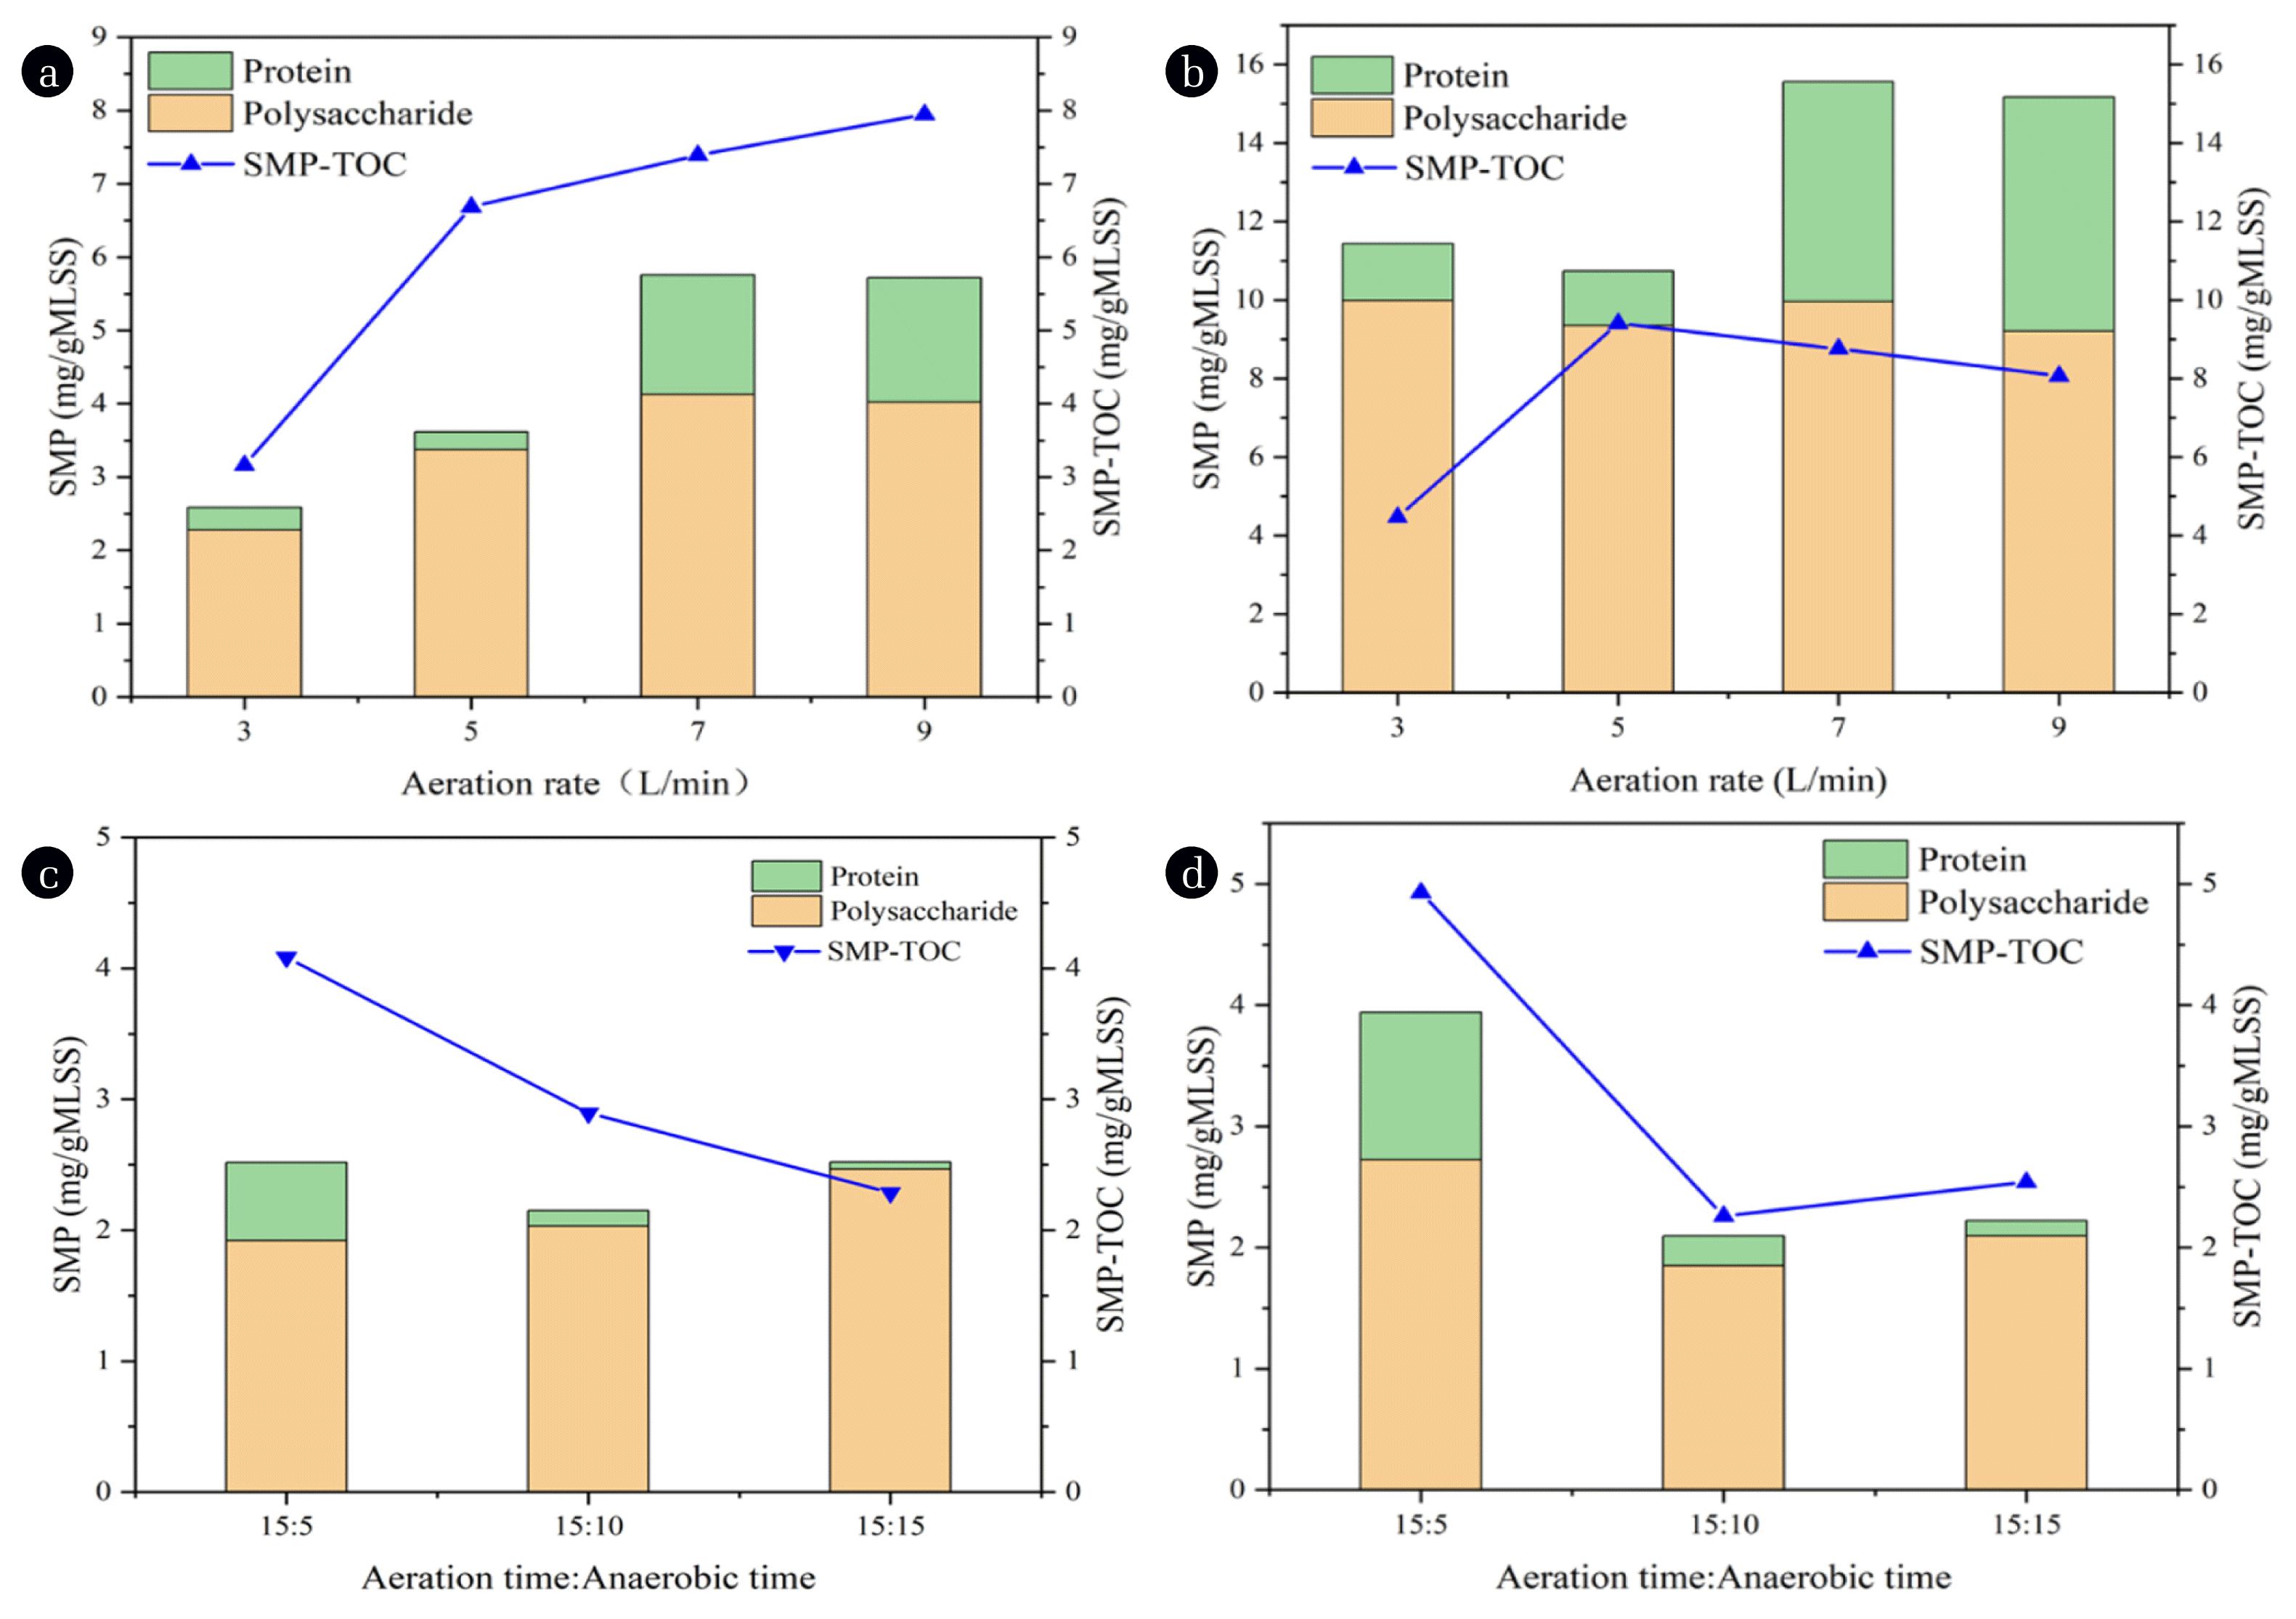
The activated sludge particle size is larger than the membrane pore diameter at different aeration rates; thus the activated sludge flocs have no direct effect on membrane pore blockage [48]. However, the activated sludge is destructed and accompanied by the release of EPS and SMP under different aeration modes, resulting in membrane fouling [49]. In this study, polysaccharides and proteins were analyzed as the major fractions of EPS and SMP. Fig. 3 and Fig. 4 show the changes in the SMP and EPS content of the sludge mixture under different operating conditions. Fig. 3(a) and (b) show that the increase of aeration rate increases the SMP concentrations in the sludge mixture based on the continuous aeration mode in 1#MBR and 2#MBR. Fig. 3(c) and (d) clearly showed that the increase of the aeration stop ratio decrease the SMP concentrations in the sludge mixture based on the intermittent aeration mode in 1#MBR and 2#MBR.
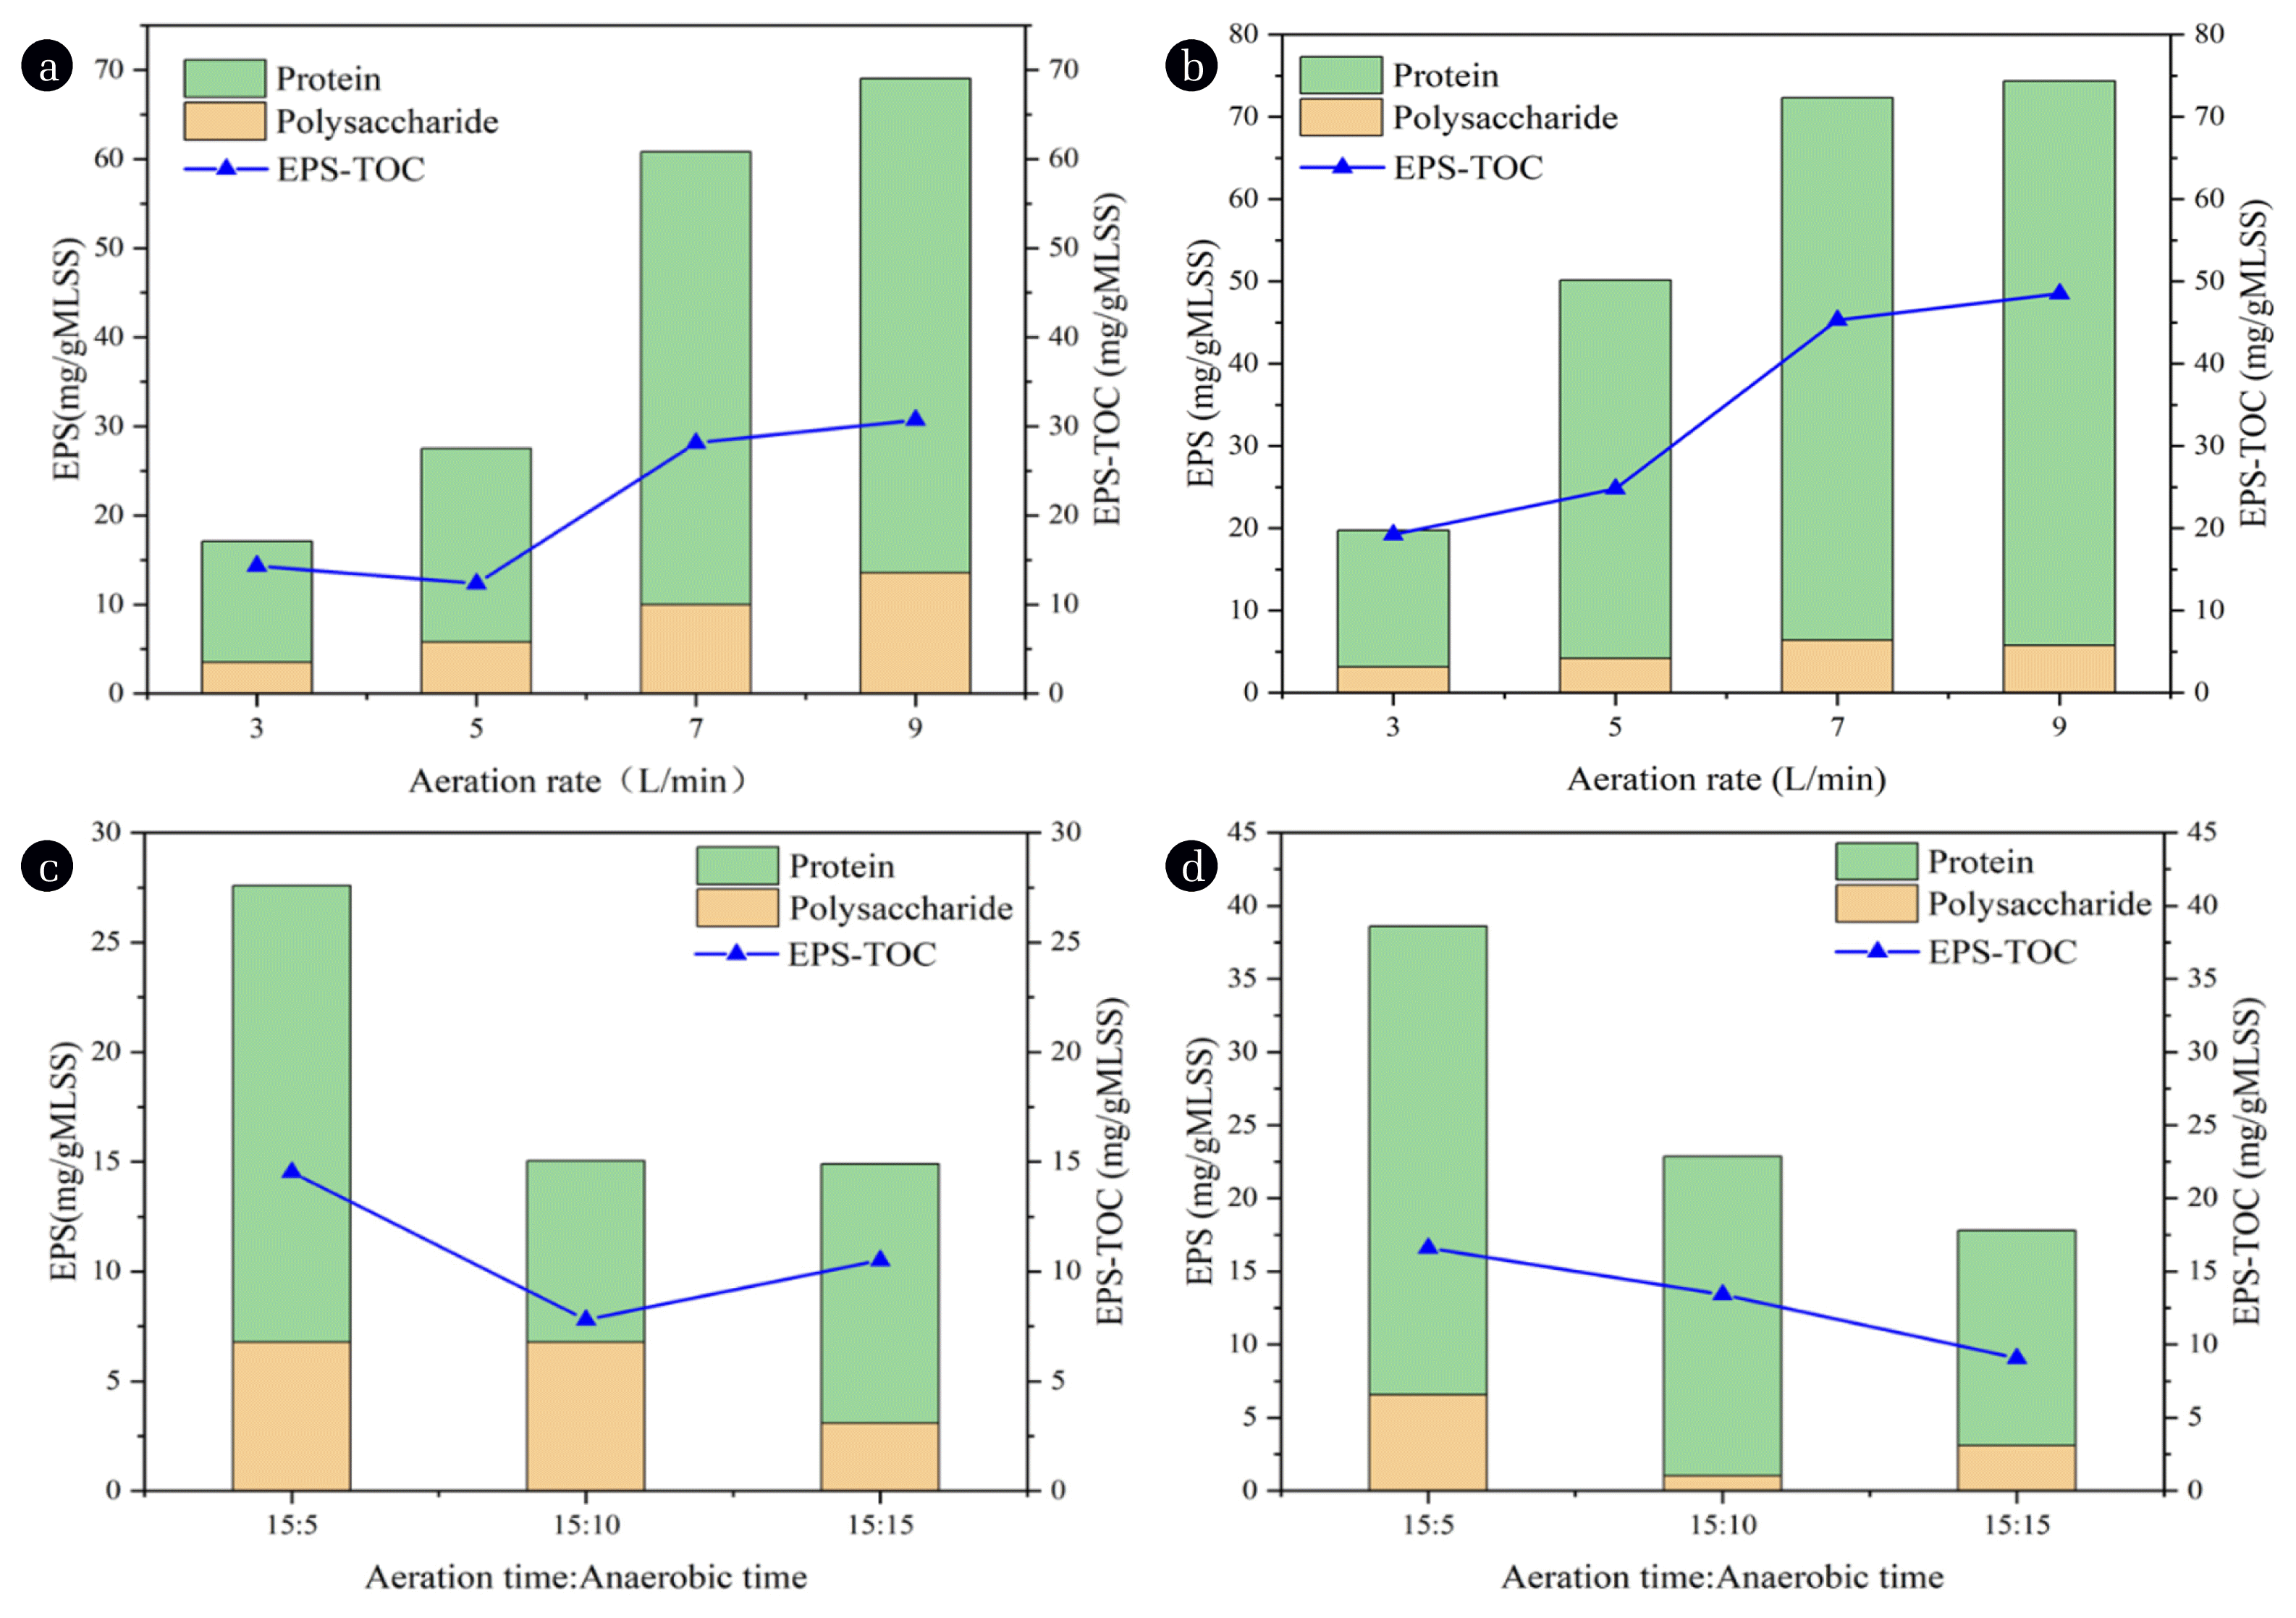
Fig. 4(a) and (b) show that the increase of aeration rate increases the EPS concentrations in the sludge mixture based on the continuous aeration mode in 1#MBR and 2#MBR. Fig. 4(c) and (d) show that the increase of the aeration stop ratio decreases the EPS concentrations in the sludge mixture based on the intermittent aeration mode in 1#MBR and 2#MBR. The reason is that the endogenous respiration of microorganisms is accelerated with the increased aeration rate, thereby increasing the EPS and SMP concentrations [50]. Under the same operating conditions, the EPS concentration is higher than the SMP concentrations. The protein percentage is high in EPS, whereas the polysaccharide percentage is high in SMP. Fig. 3 indicates that the SMP concentration in 1#MBR is lower than that in 2#MBR under the same aeration conditions. The EPS concentration in 1#MBR is lower than that in 2#MBR, as shown in Fig. 4.
3.3. Effect of Different Aeration Modes on Membrane Permeability
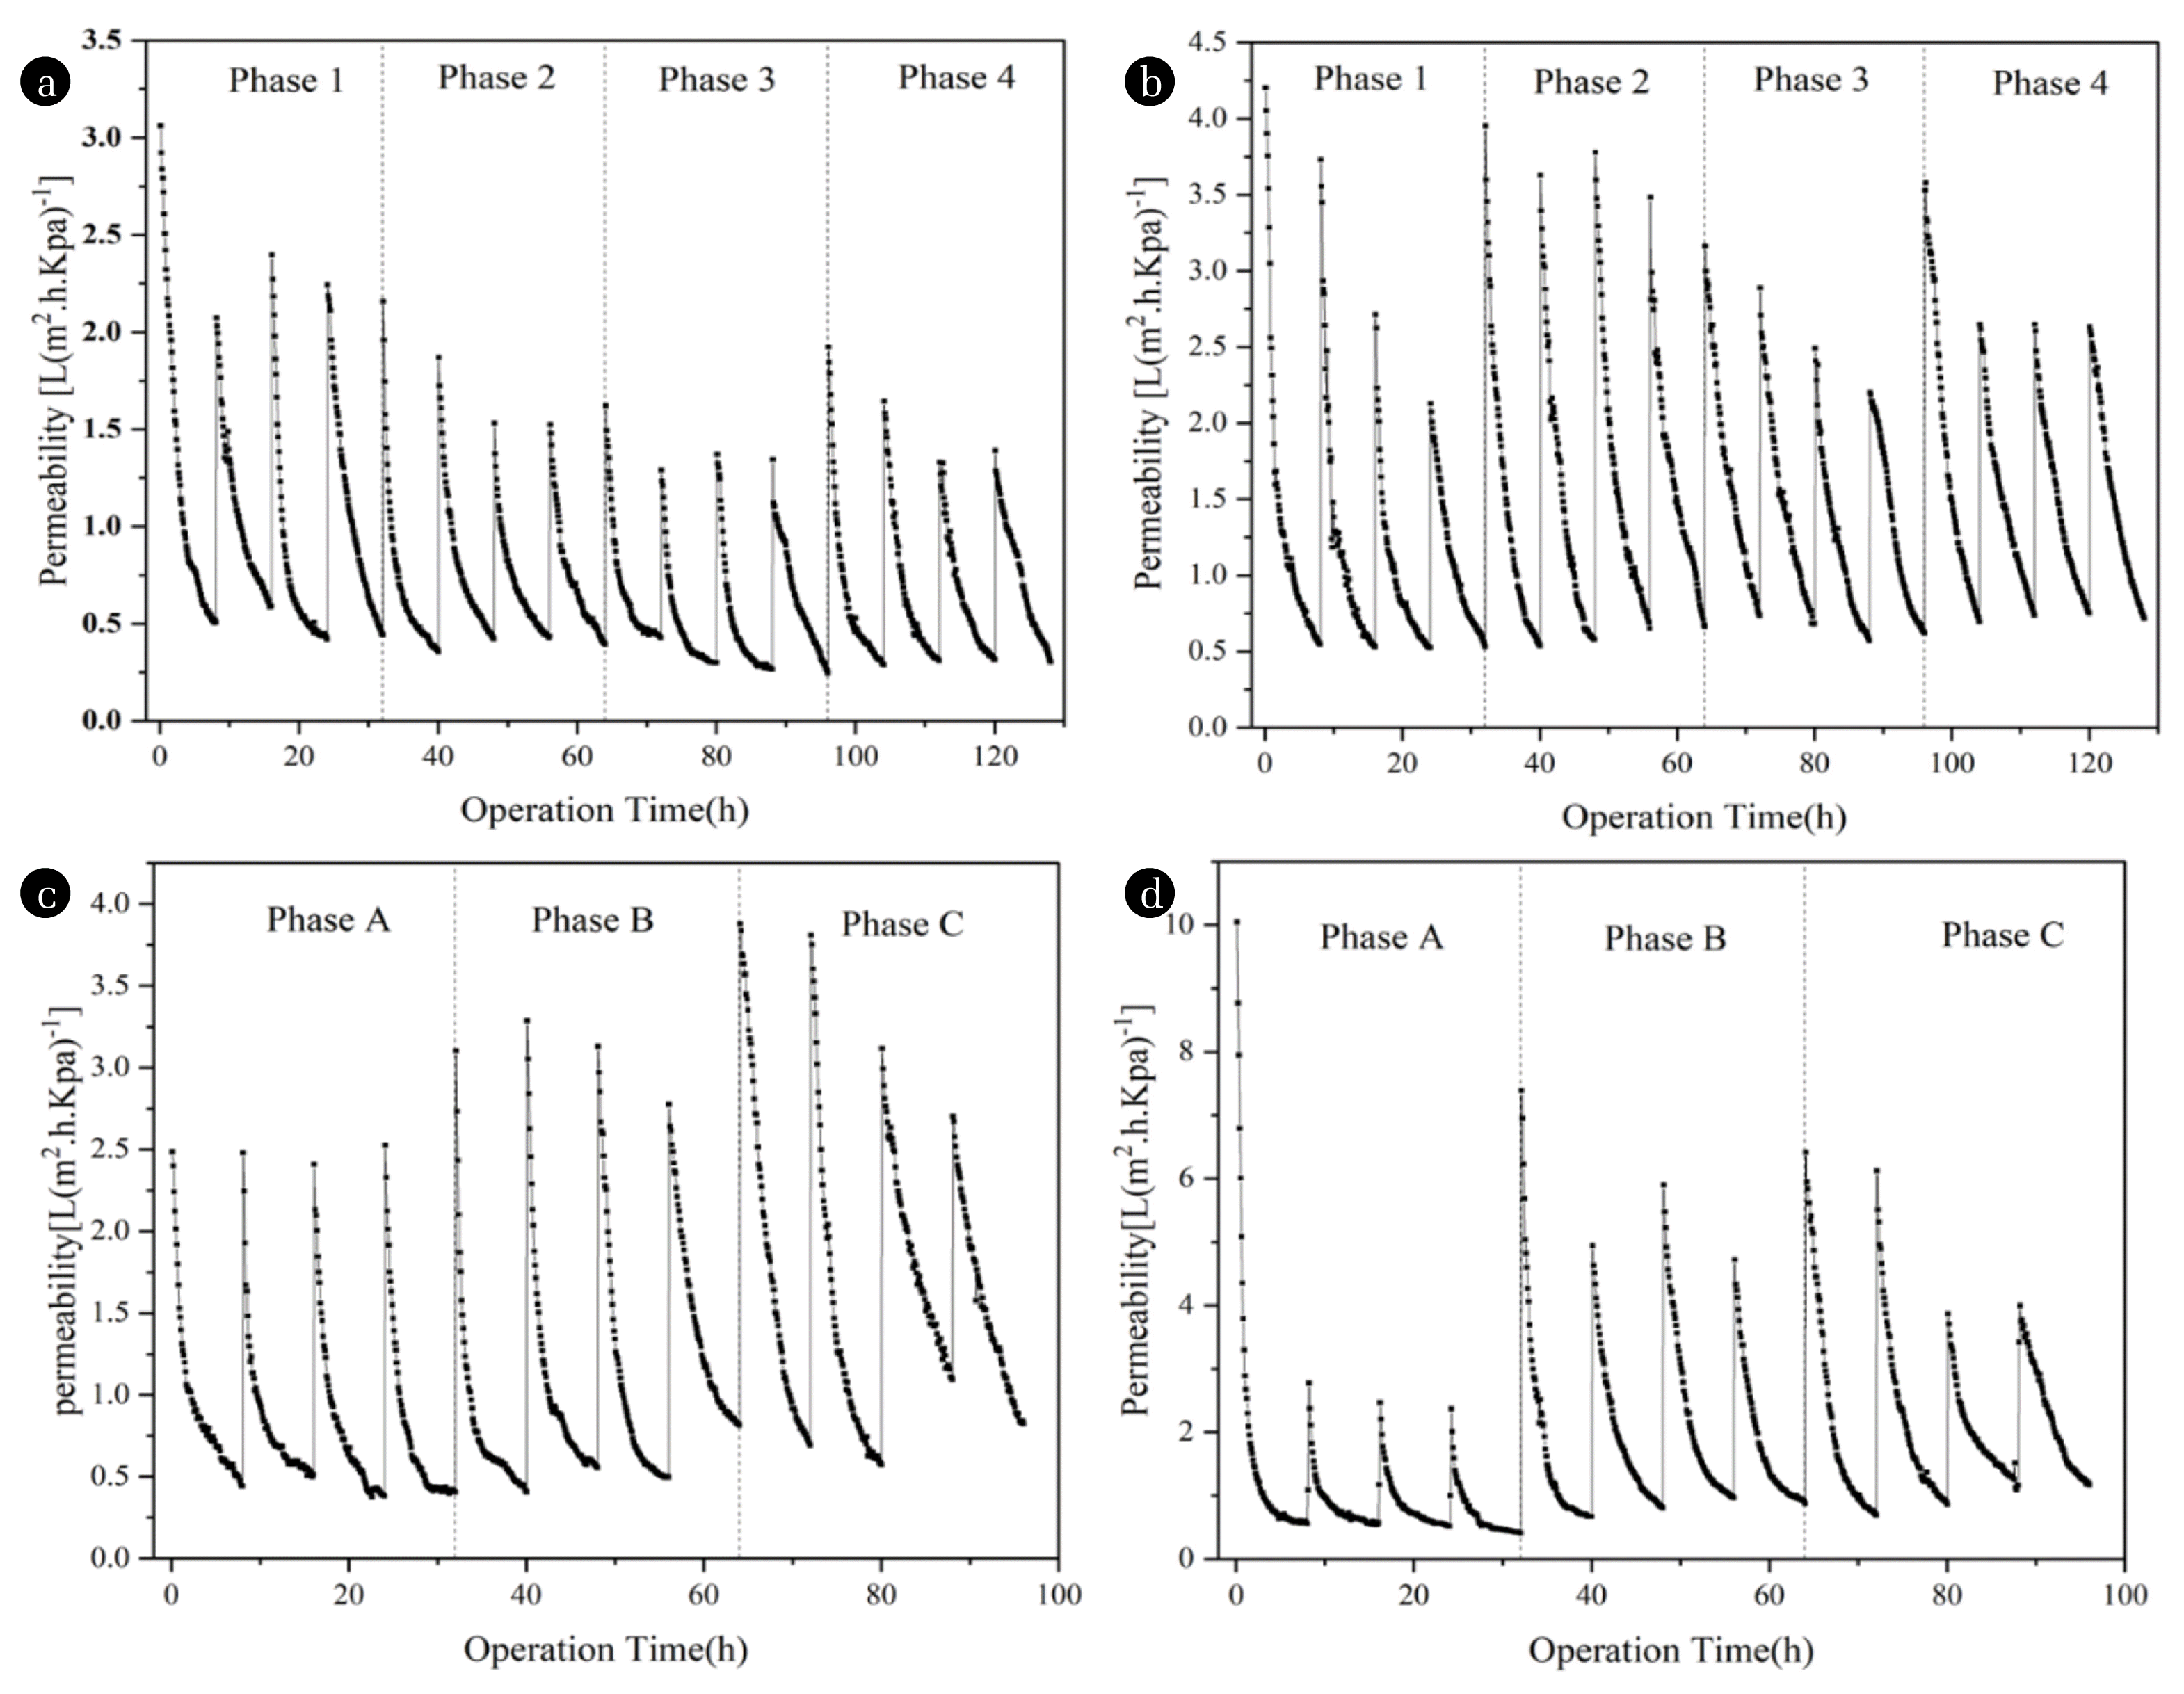
Fig. 5(a) and (b) show the membrane permeability changes for the hollow MBR and the flat sheet organic MBR, respectively, under different aeration rates based on continuous aeration mode. Fig. 5(c) and (d) show the variation of membrane permeability for the hollow MBR and the flat organic MBR, respectively, under different aeration stop ratios based on intermittent aeration mode. Fig. 5(a) and (b) demostrate that the permeability of the flat sheet origanic membrane and hollow fiber membrane in the continuous aeration mode drops daily from the start of the operation up to the end. However, the permeability can be recover to a higher level (up to 75%) the next day, and the recovery ability gradually decreases with increasing filtertion time. Fig. 5(c) and (d) clearly illustrate this phenomenon. The flux recovery ability of the membrane is related to the aeration condition. On the one hand, the aerator is flushed to the membrane surface in every operation phase. Some filter cake can be removed when the MBRs do not filtrate water. On the other hand, the probable reason is that the solids of the filter cake layer was removed slightly in the MBRs on the relaxation pause stage (when no filtration occurs) [51]. This phenomenon is fouling reversibility [52].
Fig. 5(a) shows that the average permeability of the hollow-fiber membrane in Phase 1 is higher than that in other operation phases on the continuous aeration mode. Fig. 5(b) shows that the average permeability of flat-sheet organic membrane in Phase 2 is higher than that in other operation phases on the continuous aeration mode. Fig. 5(c) illustrates that the average permeability of hollow-fiber membrane in Phase C is higher than that in other operation phases on the intermittent aeration mode. Fig. 5(d) illustrates that the average permeability of flat-sheet organic membrane in Phase B is higher than that in other operation phases on the intermittent aeration mode. Fig. S4(a) and (b) demostrate the change permeability of 1#MBR under the operation conditions of Phase1 and Phase C and the change permeability of 1#MBR under the operation conditions of Phase 2 and Phase B. We can conclude from Fig. S4(a) and (b) that the fouling rate of 1#MBR and 2#MBR on the intermittent aeration mode is lower than that on the continuous aeration mode. Moreover, the result in Fig. 3 and Fig. 4 indicate that the fouling reversibility may be related to the EPS and SMP concentrations of the filter cake layers.
Therefore, the aeration rate of 3 L/min (Phase 1) in the continuous aeration mode is more effective than that in other operation conditions. The aeration aeration stop ratio of 15:15 (Phase C) in the intermittent aeration mode in 1#MBR is more effective than that in other operation conditions. The aeration rate of 5 L/min (Phase 2) in the continuous aeration mode is more effective than that in other operation conditions. The aeration stop ratio of 15:10 (Phase C) in the intermittent aeration mode in 2#MBR is more effective than that in other operation conditions. Moreover, the 1#MBR operates effectively in the intermittent aeration mode with an aeration rate of 3 L/min and an aeration stop ratio of 15:15. However, 2#MBR operates effectively in the intermittent aeration mode with an aeration rate of 5 L/min and an aeration stop ratio of 15:10.
3.4. Analysis of Membrane Pollution
3.4.1. EEM fluorescence spectra for organic foulant characterization in the sludge mixture and membrane surface filter cake layer
The EEM fluorescence spectra of the sludge mixture and membrane surface filter cake layer in 1#MBR are shown in Fig. S5(a) and (b). Fig. S5(c) and (d) show the EEM fluorescence spectra of the sludge mixture and membrane surface filter cake layer in 2#MBR. In another work, horizontal and vertical lines were drawn to divide the EEM into five regions: region I (Ex < 250 nm, Em < 330 nm) is related to tyrosine-like, region II (Ex < 250 nm, 330 < Em < 380 nm) is related to tryptophan-like, region III (Ex > 250 nm, Em < 380 nm) is related to fulvic acid, region IV(Ex< 50 nm, Em>380 nm) is related to soluble microorganism, and region V(Ex > 250 nm, Em > 380 nm) is related to humic acid [53].
Fig. S5(a) and (c) illustrate two peaks in the region II and IV, respectively. The peak intensities of region II is higher than those of region IV, as shown in Fig. S5(a), whereas region II is lower than region IV, as shown in Fig. S5(c). The main membrane foulant in the mixture includes proteins and solubl microorganisms and a little humic and fulvic acids. In the 1#MBR sludge mixture, the concentrations of proteins are higher than those of solubl microorganisms. However, the opposite is true in 2#MBR, maybe because of the activited sludge concentrations. Fig. S5(d) shows the two peaks in region I and III, whereas Fig. S5(c) shows the three peaks in the region I, II and IV. The main membrane foulant in the surface filter cake layer incledes proteins and fulvic acids in 1#MBR. However, the main membrane foulant in the surface filter cake layer includes proteins and solubl microorganisms in 2#MBR. The probable reason may be related to the membrane materials and membrane module.
3.4.2. Analysis of membrane morphology and EDS
Fig. S6 and Fig. S7 show the SEM-EDS of clean and fouled hollow fiber membrane and flat sheet organic membrane. Fig. S6(a) to (d) show that fouling adhered to the membrane surface to form the filter cake layer, and the multihole membrane became compact. This phenomenon can also be observed in Fig. S7. This finding indicated that pore blocking and cake layer blocking occur in hollow fiber membranes and flat sheet organic membranes to form membrane fouling.
In Fig. S6 and Fig. S7, SEM-EDS shows that Fe, Na, Mg, and Zn elements are distributed equably, and O, N, C, Si, Al, and Ca elements are in the dense cake layer on the membranes. Table S4 presents the element content on the fouling membrane surface. The result indicated that the O, C, N, and Si elements account more than 80% of the total content element, whereas the Al, Fe, Ca, Na, Mg, and Zn elements occupy less than 20% of the total content element. According to the result above, the membrane fouling includes protein, polysaccharides, and other organic compounds.
3.4.3. Analysis of microbial community structure
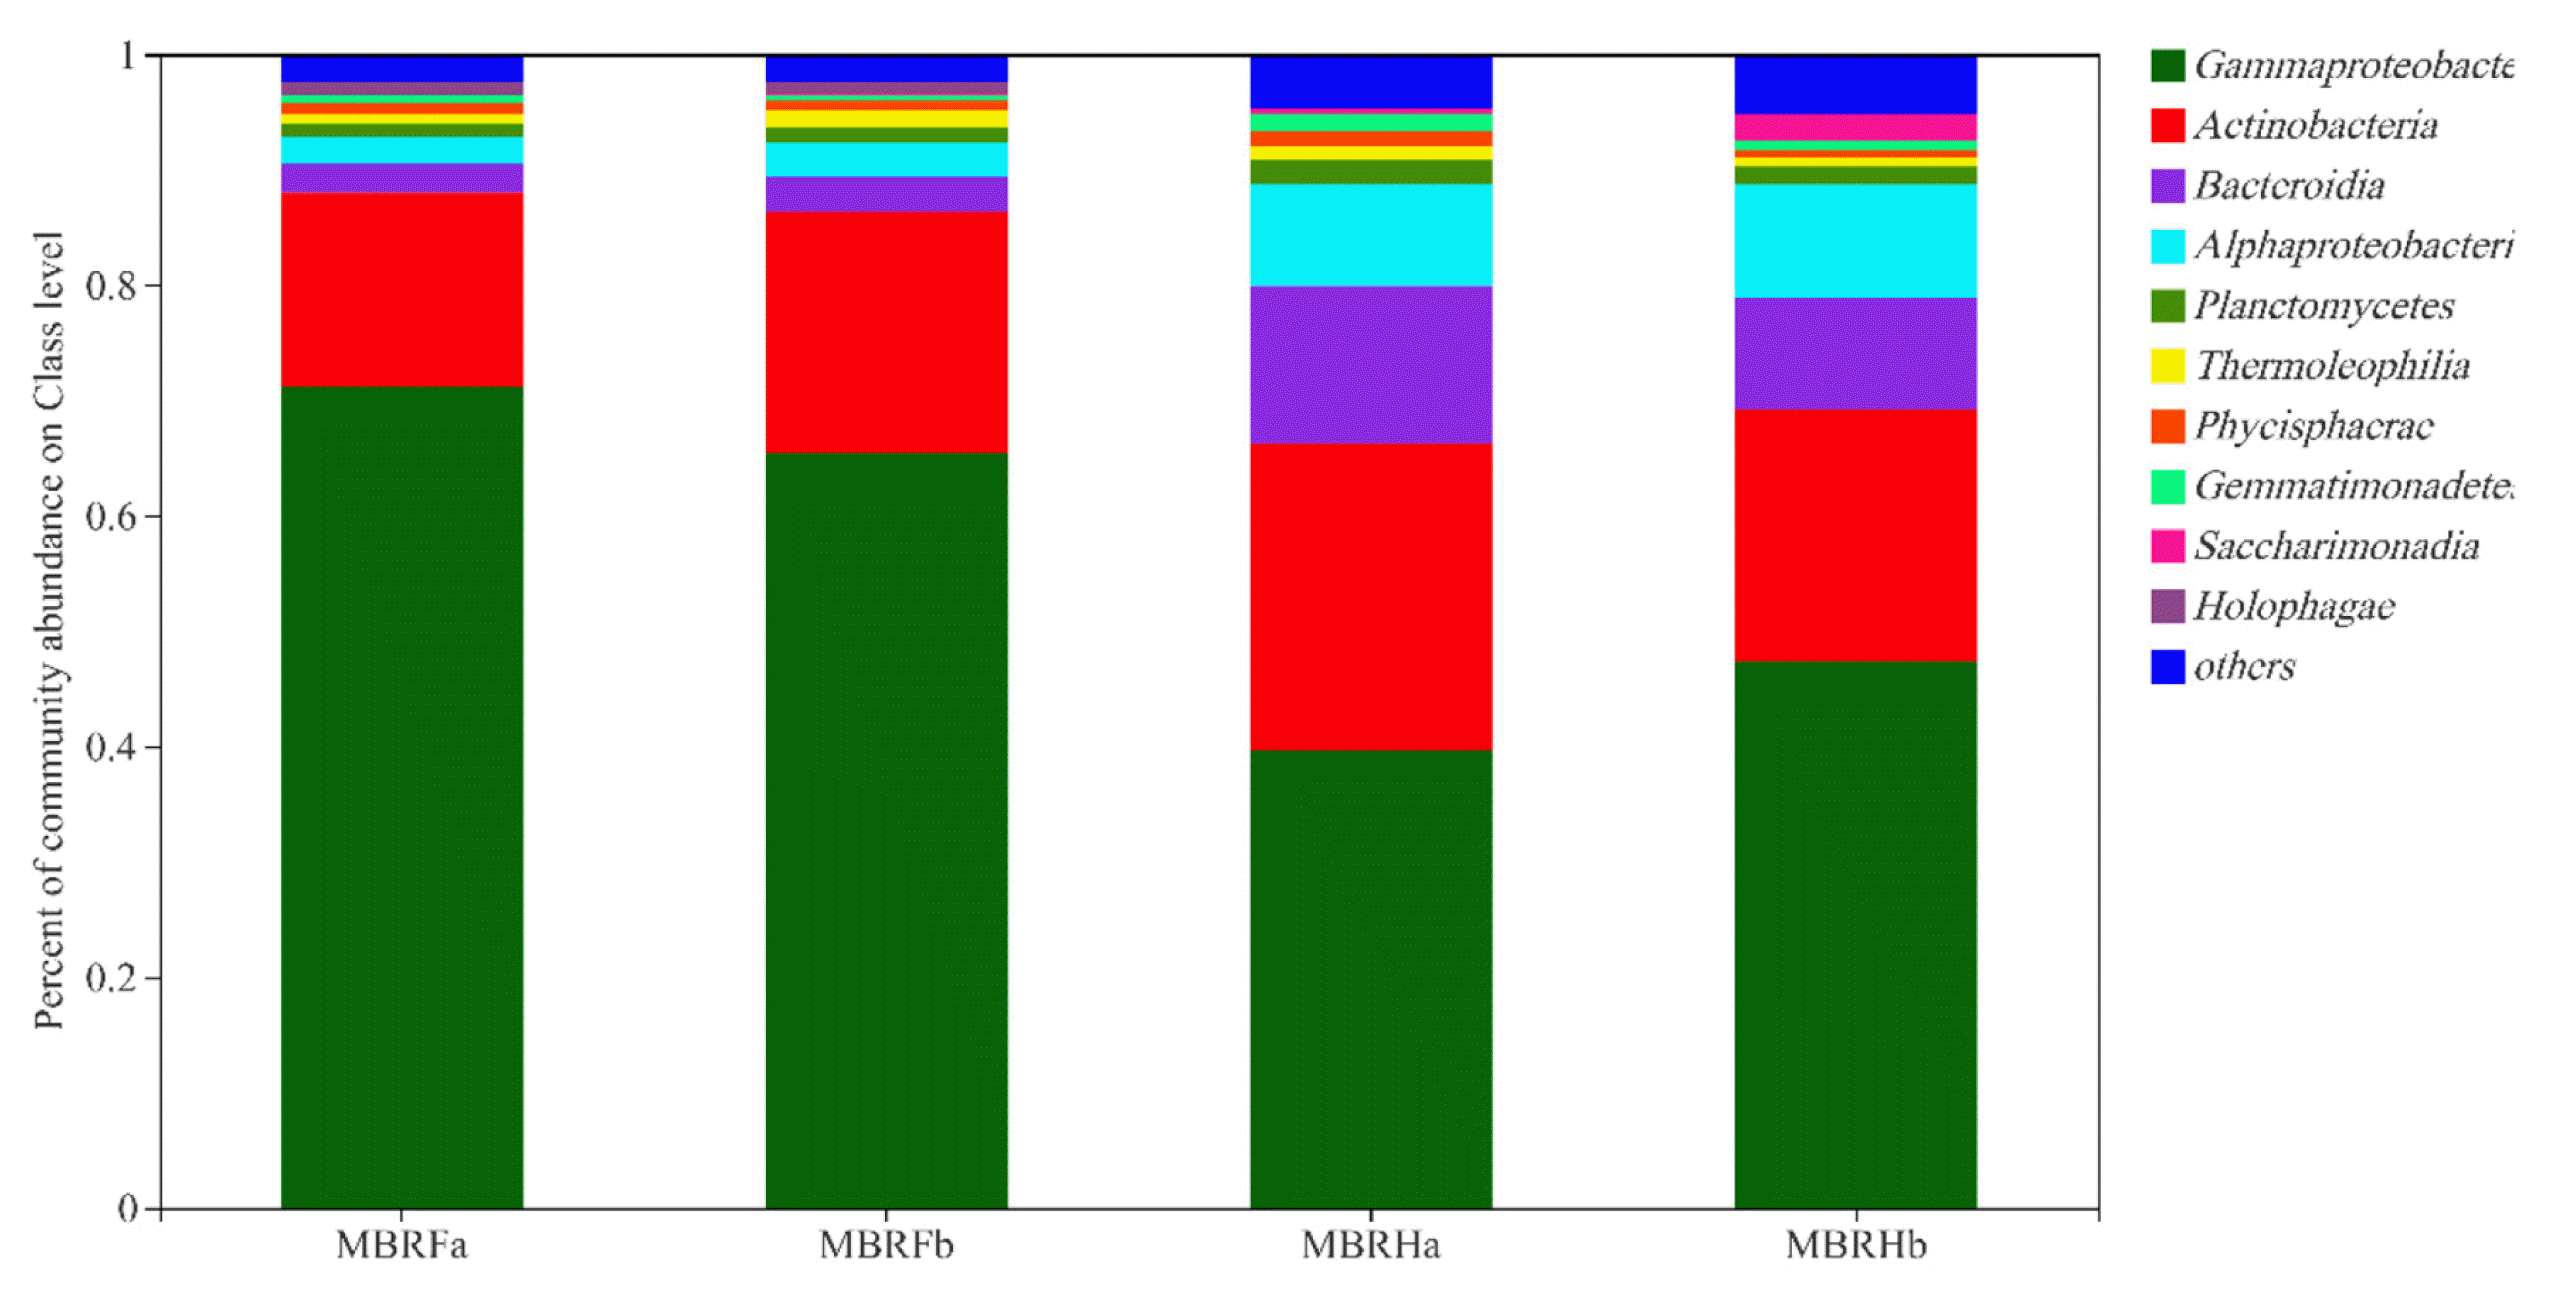
Recent studies showed that membrane fouling is related to the microbial community [32, 54, 55]. The microbial community structure at the class level of the sludge mixture and membrane filter cake layer in MBRs is shown in Fig. 6. In particular, 1#MBR contains eight groups (relative abundance higher than1%) of sludge mixture, including Gammaproteobacteria(39.7%), Actinobacteria(26.6%), Bacteroidia(13.6%), Alphaproteobacter-ia(8.7%), Planctomycetes (2.1%), and six groups of membrane filter cake, including Gammaproteobacteria (47.3%), Actinobacteria(21.9%), Bacteroidia (9.6%), and Planctomycetes (1.6%). Morever, 2# MBR comprises six groups of sludge mixture (relative abundance higher than 1%), including Gammaproteobacteria (71.2%), Actinobacteria (16.7%), Bacteroidia (2.5%), Alphaproteobacteria (2.3%), and six groups of the membrane filter cake layer, including Gammaproteobacteria (65.4%), Actinobacteria (20.9%), Bacteroidia (2.9%), and Alphaproteobacteria (3.0%). These results suggested that the dominant class of 1#MBR and 2#MBR is Gammaproteobacteria. Most of them acquire nutrients by decomposing organic matter under aerobic and facultative anaerobic conditions. Several studies showed that Gammaproteobacteria is an important class of bacteria [56] related to nitrogen removal. Therefore, as the dominant class in the sludge mixture, Gammaproteobacteria can easier adhere to the membrane surface.
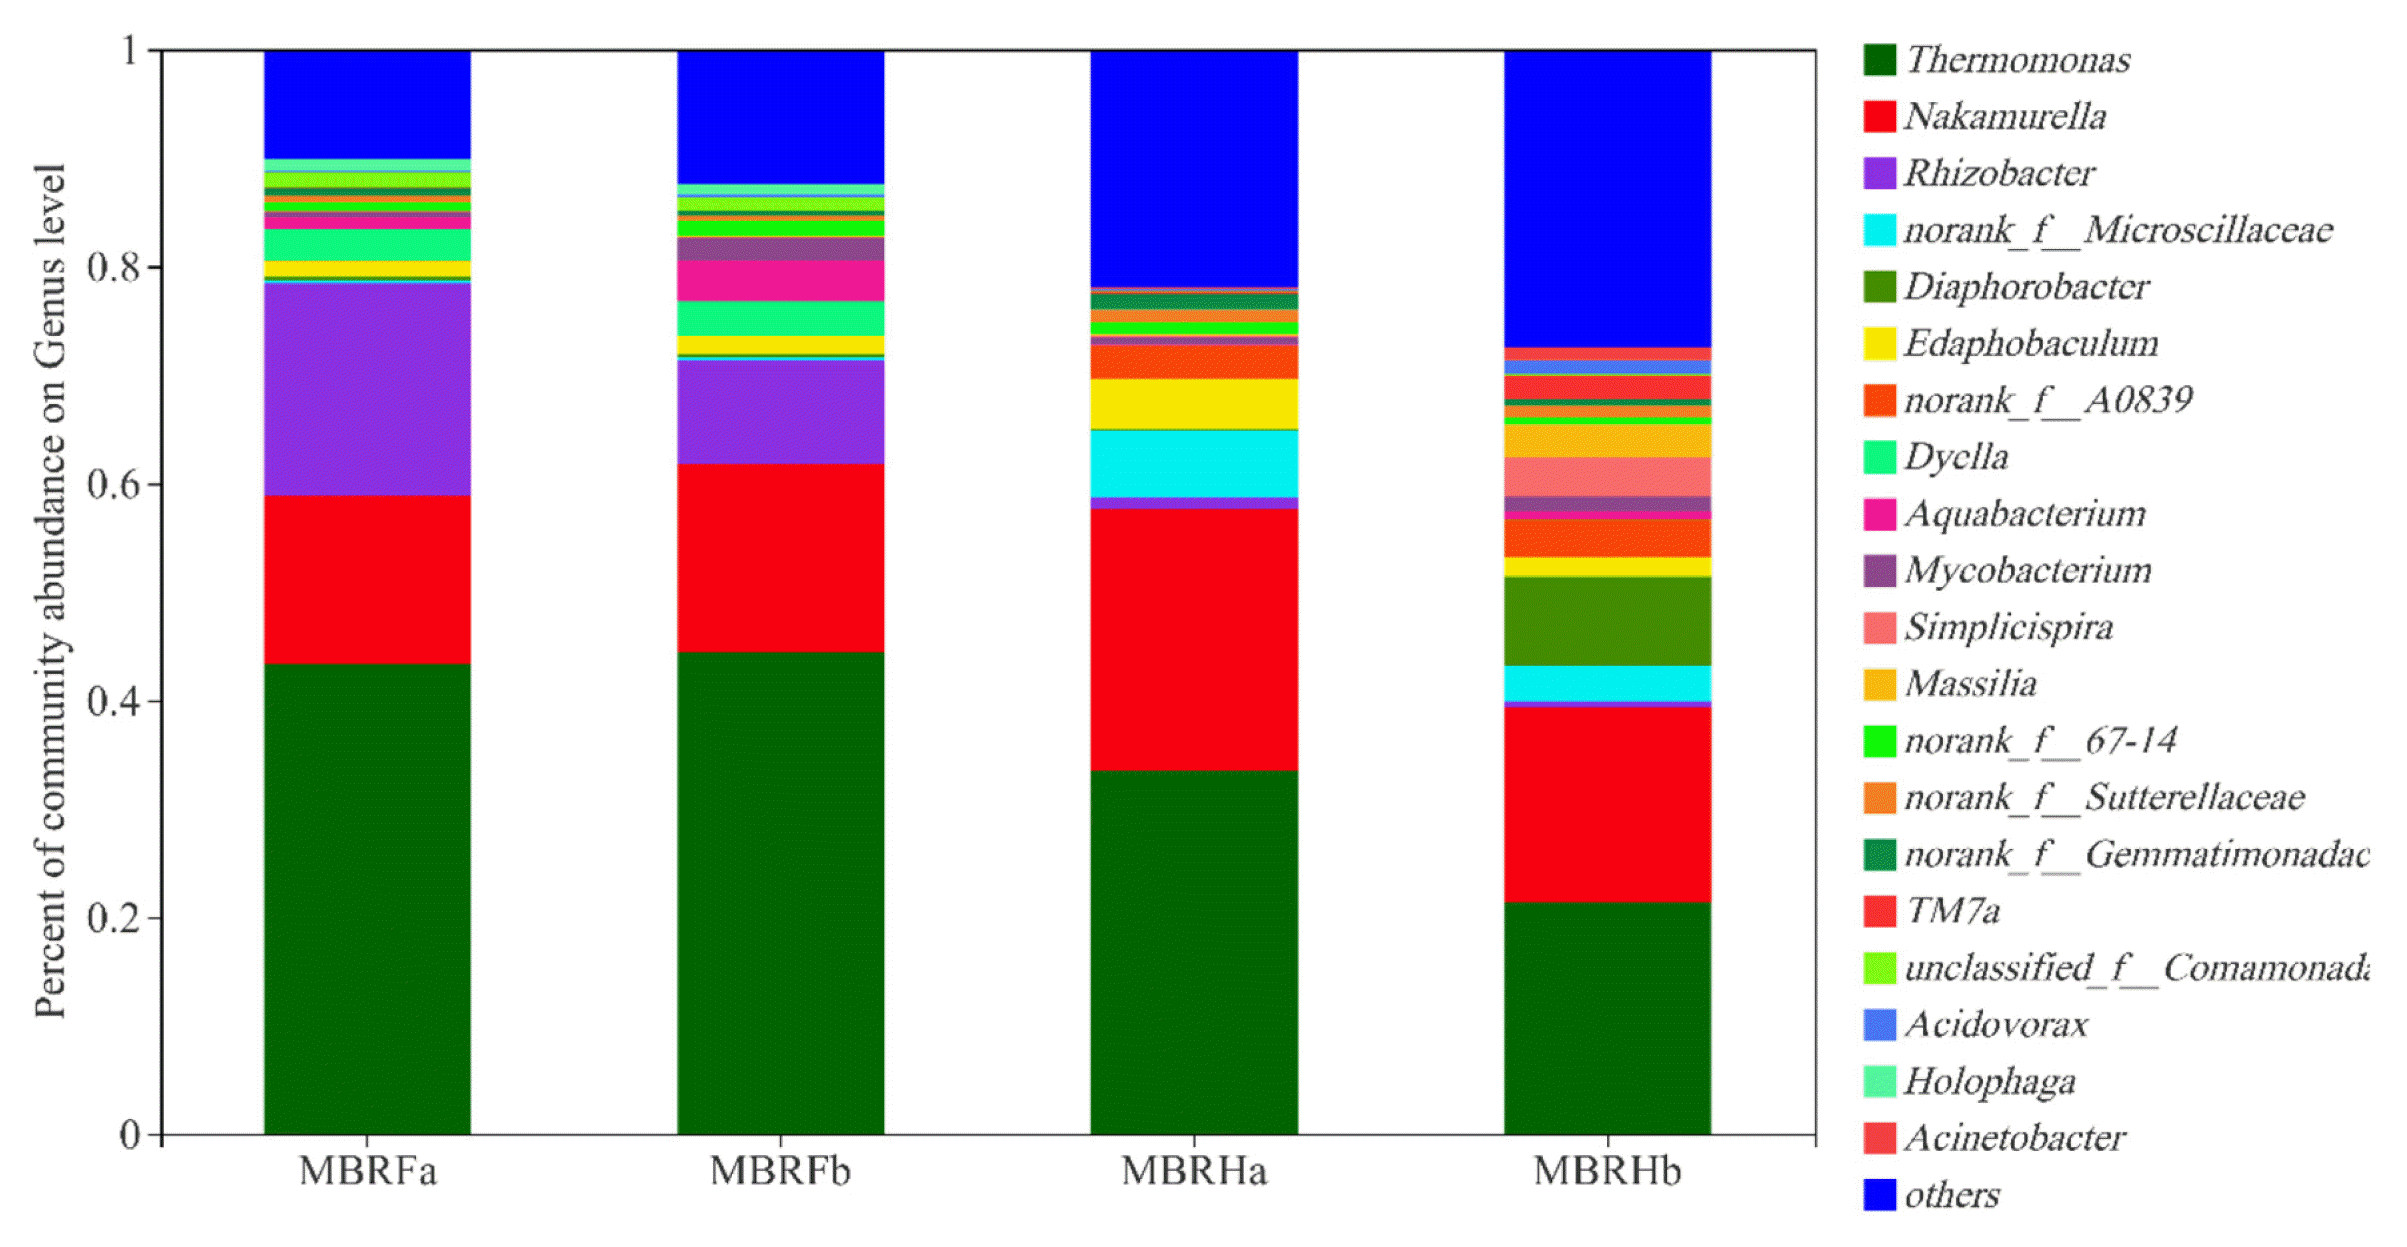
Fig. 7 demostrates that the microbial community structure of 1#MBR and 2#MBR at the genus level of the sludge mixture considerably differes from that of the membrane filter cake layers. In particular, 1#MBR contains eight groups (relative abundance higher than 1%) of sludge mixture, including Thermomonas (33.5%), Nakamurella (24.1%), norank_f_Microscillaceae (6.19%), Edaphobaculum (4.55%), norank_f_A0839 (3.07%), and norank_f_Gemmatimonadaceae (1.47%), and 12 large groups (relative abundance higher than 1%) of the membrane filter cake layer, including Thermomonas (21.3%), Nakamurella (18.0%), Diaphorobacter (8.26%), Simplicipira (3.59%), norank_f_A0839 (3.45%), Massila (3.01%), TM7a (2.11%), Mycobacterium (1.38%), and Acinetobacter (1.14%). Morever, 2#MBR comprises eight groups (relative abundance higher than 1%) of the sludge mixture, including Thermomonas (43.3%), Nakamurella (15.4%), Rhizobacter (19.6%), Dyella (2.98%), Comamonadaceae (1.4%), and Edaphobaculum (1.36%), and nine groups (relative abundance higher than 1%) of the membrane filter cake layer, including Thermomonas (44.4%), Nakamurella (17.4%), Rhizobacter (9.57%), Dyella (3.14%), Aquabacterium (3.7%), Mycobacterium (2.14%), Edaphobaculum (1.68%), and Comamonadaceae (1.1%). These findings suggested that the membranes are fouled by the biofilm formed through the microorganisms, and the microbial communities in the membrane filter cake layers differ from those in the sludge mixture. In addition, 12 groups (relative abundance higher than 1%) of filter cake layers on the surface of 1#MBR include more than 9 groups of filter cake layers on the surface of 2#MBR. However, the same groups (relative abundance higher than 1%) exist in 1#MBR and 2#MBR (8 groups each) at the genus level of the sludge mixture. The richness and diversity of bacterial communities at the genus level on the hollow-fiber membrane surface of 1#MBR were higher than the flat-sheet organic membrane of 2#MBR. Therefore, the hollow-fiber membrane surface of 1#MBR is more suitable for microbial growth and more likely to perform biofilm that causes biofilm fouling than the flat-sheet organic membrane of 2#MBR is. Mariana [57] showed that Thermomonas may be potential targets for microfouling. Several studies [58, 59] showed that Xanthomonas of Gammaproteobacteria is identified as an EPS producer and related to fouling development. The results suggested that the predominant dominant genera of 1#MBR and 2#MBR include Thermomonas. However, the Thermomonas relative abundance of sludge mixture and filter cake layer in 1#MBR is lower than that of sludge mixture and filter cake layer in 2#MBR. Fig. 4 shows the EPS concentration of sludge mixture in 1#MBR is lower than that in 2#MBR. Therefore, the EPS concentration and the relative abundance of Thermomonas have positive correlation. Because Thermomonas belongs to the same Gammaproteobacteria as Xanthomonas. So Thermomonas can also synthesize EPS and attach to the membrane surface to promote membrane fouling formation. Morever, reducing the abundance of Thermomonas may reduce EPS synthesis. This approach may be used as a strategy to mitigate biofilm fouling.
4. Conclusions
In this study, the effect of aeration mode on hollow-fiber and flat-sheet organic MBRs for greywater treatment was investigated. There was no significant difference between the removal rates of COD, and NH4+-N by MBRs under the two aeration modes, whereas those of TN and TP under the intermittent aeration mode were higher than those under the continuous aeration mode. In terms of permeability changes, both hollow-fiber and flat-sheet organic MBRs performed well in the intermittent aeration mode with aeration rates of 3 and 5 L/min and aeration stop ratios of 15:15 and 15:10, respectively. MBRs in intermittent aeration mode could mitigate membrane fouling and were more appropriate for operation owing to the lower EPS and SMP production. This is because as the aeration rate and time increase, the sludge floc breaks up, microbial metabolism accelerates, and SMP and EPS concentrations increase, thus increasing membrane fouling. Moreover, because Thermomonas is one of the bacterial genus that synthesizes EPS and attaches to the membrane surface to promote membrane fouling, its relative abundance plays an important role in membrane fouling. The richness and diversity of bacterial communities at the genus level on the hollow-fiber membrane surface were higher than that on the flat-sheet organic membrane. This is because the membrane surface of hollow-fiber MBR is more suitable for microbial growth and performs biofilm-fouling easier than the surface of flat-sheet organic MBRs. Moreover, membrane fouling was caused by the blocking of the membrane surface by protein, polysaccharides, and humic-acids layer. In summary, MBRs under the intermittent aeration mode were more appropriate for greywater treatment with higher treatment efficiencies, and permeability and lower energy.