Fixed bed column modeling of lead(II) and cadmium(II) ions biosorption on sugarcane bagasse
Article information

Abstract
In this paper the results of the biosorption of lead(II) and cadmium(II) with sugarcane bagasse in fixed bed columns are presented. Experimental data were fitted to several models describing the rupture curve for single-component and two-component systems. The percentages of removal of lead and cadmium in single-component systems are 91% and 90%, respectively. In lead-cadmium bicomponent systems the percentage of elimination of lead was 90% and cadmium 92%. In single-component systems, Yoon-Nelson and Thomas models successfully reproduce the rupture curves. In two-component system, the Dose-Response model was the best one reproducing the experimental rupture curves in the entire measured range.
1. Introduction
The problem of contamination by toxic metals arises as a result of human activities: industry, agriculture and mining waste disposal. These pollutants are discharged into the environment reaching concentrations above the permissible values in international laws, and therefore, water resources being in the highest risk for its high rate of propagation. Heavy metals present in high concentrations in industrial discharges may cause physical, chemical and biological changes in the composition of water bodies, such as turbidity, increased oxygen demand, changes in pH and others [1–6]. They can also generate the death of higher organisms, in addition to seriously compromise the quality of water that is required for human consumption, their toxic effect on living beings is caused by inhibiting or blocking biological activities, causing irreversible damage [1]. Currently, mining is concerned on environmental pollution because its actual treatment is obsolete, so for this, alternative processes have been recently investigated [7–11].
Current technologies for removing metals are extremely expensive or complicated, particularly in solutions with less than 100 mg L−1 of metal, they also generate other toxic wastes (sewage sludge) and in some cases, it is difficult to achieve and maintain strict regulatory requirements [12, 13]. So, it is urgent to find new technologies or materials for metal removal, where biosorption is seen as a new alternative for metal removal over traditional processes in wastewater disposal [14, 15].
Biosorption of heavy metals using different biomasses (agro-industrial waste or organic waste that are considered composting material) is still under investigation; although other studies presented advantages compared with conventional techniques of removing heavy metals, it is important to identify which biomasses with more adsorption capacity to be applied in the future on an industrial level [1]. Consequently, it is important to find low-cost alternative materials instead of traditional biosorbents like activated carbon, although it has proved successful in removing heavy metals, its application has been limited because of its regeneration difficulties and costly acquisition [16]. Among the different agro-industrial wastes, sugarcane bagasse is an attractive material for removing toxic heavy metals from wastewater. It is a complex material containing cellulose, hemicellulose and lignin as major constituents, with an abundant hydroxyl and carboxylic acid groups. Many studies have demonstrated the adsorption effectiveness of different metals including nickel(II), copper(II) and chromium(VI) [17–19]. Nevertheless, most of these studies are focused on the uptake of single metals. In practice, wastewaters contain multiple metal ions. Therefore, it would be attractive to assess the competitive biosorption capability of the sugarcane bagasse in systems with multiple ions.
Studies in adsorption by batch experiments (discontinuous) provide a measure of the efficiency of adsorption in removing specific elements and the maximum adsorption capacity. In addition, they are useful in determining optimum operating conditions (pH, particle size, contact time, etc.) as well as the mechanisms involved in the process. The most used adsorption type in the treatment of industrial wastewater is the fixed bed column system [20, 21].
The aim of this study was assessing the removal of Pb+2 and Cd+2 in fixed bed column with sugarcane bagasse. Experimental data were fitted to several models describing the rupture curve for single-component and two-component systems.
2. Materials and Methods
2.1. Biosorbent Preparation and Characterization
The sugarcane bagasse (SGC) was obtained in Portovelo, coastal area south of Ecuador. It was washed with distilled water many times and dried at room temperature. Then it was grinded with strong grinder and sieved to < 1 mm particle size.
Relative and apparent densities of the biosorbent was measured by using a water pycnometer and the test tube method, respectively. The porosity of the biosorbent (ɛ) was estimated from its relationship with the density, according to Eq. (1):
where ρap is the apparent density (g mL−1) and ρrel is the relative density (g mL−1).
The point of zero charge was measured by using the test the method of the pH derivative. In six Erlenmeyers of 250 mL, 50 mL of distilled water was added. The pH values of each Erlenmeyer were adjusted with 0.1M HCl or 0.1M NaOH to obtain pH of 3, 4, 5, 6, 8 and 10. Then, 0.5 grams of the biosorbent was added to each Erlenmeyer. After, the Erlenmeyer was placed in the shaker for 48 continuous hours at 150 rpm at room temperature (20.5°C). After 48 h of agitation of the samples, they were filtered, collecting the solution in a beaker. Subsequently the pH of each of the samples was determined. To find the point of zero charge, the initial pH was plotted against final pH, also drawing a line to determine the pH at which the curve is cut. The cut-off pH value determines the pH at the zero charge point. The BOEHM method was used to determine the acid and basic sites [22]. Surface functional groups were analyzed using Fourier Transform IR (FTIR) spectra (20SXB, Perkin Elmer).
2.2. Biosorption Studies
The metal solutions of each ion were prepared at an initial concentration of 10 mg/L for all the experiments. Experiments were carried out in two glass columns, with dimensions of 1.5 cm and 1.6 cm internal diameter, both with a height of 50 cm. The preparation of the columns was carried was carried out by introducing gravel particles with 2 mm of diameter at the bottom of the columns so biosorbent particles are not entrained in the biosorption process. Then, the biosorbent was introduced inside the column, up to the bed height corresponding to each experiment. Finally, the top of the column was filled with a 5 mm gravel to avoid the bed’s floating and loss of material. The system operation was performed with downward flow. The biosorption tests were performed at room temperature (17°C). Samples were collected with a frequency of 5 min for the first 100 min and then every 10 min, until reaching saturation of the biosorbent. The hydrodynamic study allowed to find out that the best operating conditions were: flow rate through the column of 1.6 mL min−1, particle size > 0.594 mm (mean fraction), bed height of 28 cm and 7.15 g of biomass for filling. The concentrations of lead and cadmium were determined using atomic absorption technique using an Atomic Spectrophotometer (Aanalyst 400, Perkin Elmer).
2.3. Biosorption of Heavy Metals in Continuous Systems
The operation and efficiency of fixed bed columns are described by the concept of the rupture curve, which results from plotting the concentration (C/Co) versus time or treated volume. The operating time and the shape of the curve are very important characteristics to determine the response of a biosorption column [23]. From a practical standpoint, the time at which the saturation occurs, ts, is set when the effluent concentration exceeds a value between 90% and 95% of the initial concentration. Parameters that control the saturation of the column are the operation time, the space and the column length. At the moment in which the metal concentration in the effluent reaches a certain value, usually when the concentration of adsorbate reaches 10% of the initial concentration, one gets the rupture point (Cb) and corresponds to a time called service time or rupture time (tr), which determines the volume of treated effluent.
2.3.1. Operating parameters of the column
To evaluate the column performance, several parameters has been defined: the effluent volume Vef (Eq. (2)), the maximum adsorption capacity or the column qtotal (Eq. (3)), the adsorption capacity q10 (Eq. (4)), the total amount of metal passing through the column mtotal (Eq. (5)), the total percentage of metal retained during the operation Rc (Eq. (6)) and
where Q is the flow rate through the column (mL min−1), ttotal is the total operating time (min), CR is the retained metal concentration (mg L−1), t10 is the time required to achieve an effluent concentration of 10% of the feed concentration (min) and mB is the biosorbent mass (g).
Calculating the length of unused bed (SNU) is a method to evaluate the adsorption capacity of biosorbents in continuous flow columns [24].
where H is the bed height (cm), ts is the saturation time and tr is the time at the rupture point (min).
2.4. Mathematical Modeling of the Biosorption Process in Columns
Among the mathematical models used to describe the dynamic behavior of a specific contaminant removal in fixed bed columns, the Yoon-Nelson, the Thomas and the Dose-Response models have been widely applied.
2.4.1. Yoon-Nelson model
Yoon and Nelson [25] developed a relatively simple model aimed at adsorption of vapors or gases on activated carbon. This model assumes that the speed with which the likelihood of adsorption for each adsorbate molecule decreases is proportional to the probability of adsorption of the adsorbate and the probability that it does not get adsorbed; this model, besides being the less complex, does not require data concerning the characteristics of the adsorbate, the type of adsorbent or physical properties of the bed and is frequently used to predict the dynamic behavior of single or binary composition systems. Eq. (8) describes the model:
where C is the concentration of the effluent at the column outlet (mg L−1), C0 is the initial metal concentration (mg L−1), t is the operating time (min), KYN is the constant of proportionality of Yoon-Nelson (min−1) and τ is the time required to retain 50% of the initial adsorbate (min).
2.4.2. Thomas model
The Thomas model [26] is one of the most general and used to describe the behavior of biosorption process in fixed bed columns. This model is used to know the maximum adsorption capacity of an adsorbent and obtain the theoretical yield of the column. This model assumes that there is a plug flow without axial dispersion in the bed and that the driving force follows the Langmuir isotherm and second-order reversible reaction kinetics considering that biosorption is not limited by the chemical reaction, but is controlled by the mass transfer at the interface. This difference can lead to errors when this method is used to model biosorption processes under certain conditions. The model is described by Eq. (9):
where Kth is the velocity constant of the Thomas model (mL min−1 mg−1), q0 is the adsorption capacity (mg g−1), mB is the mass of the biosorbent (g) and Q flow rate through the column (mL min−1)
2.4.3. Dose-Response model
This model has been commonly used in pharmacology to describe different types of processes, it is currently being used to describe the processes of biosorption in column, which has a relative importance because it describes the complete rupture curve with high accuracy, in addition it can minimize errors resulting from using the Thomas model, especially at low or high removal times. The equation is a function of both the volume of the effluent and the time (Eq. (10)) [27, 28].
where α is an empirical parameter.
3. Results and Discussion
3.1. Physicochemical Properties of the Biosorbent
Physical characterisation of the SCB samples showed a relative and apparent density of 1.043 g mL−1 and 141 g L−1, respectively, providing a porosity of 0.88. The SCB presented more acidic sites than basic sites therefore it is considered acidic which is corroborated by the point of zero charge. The surface of SCB becomes negatively charged at pH values higher than 6.11 and acquires a net positive charge at pH value less than 6.11. The Infrared spectrum revealed the presence of different functional groups. Functional group belongs to cellulose can be observed between 1,050 and 1,032 cm−1. Absorption peaks in the region 3,540-3,200 cm−1 were also showed, which are usually due to several variations for extension of the -OH groups. The broad shape and intense peak of 3,338 cm−1 observed corresponds to the O-H bond. Finally, absorption peaks in the region 1,750-1,150 cm−1 are related to the cellulose.
3.2. Influence of pH on the Speciation of Lead(II) and Cadmium(II)
Fig. 1, made with the HYDRA and MEDUSA software (Hidra-Hydrochemical database- Medusa- Chemical Diagrams), shows species distribution diagrams of lead and cadmium in aqueous solution versus pH. Data suggested to work in a pH range between 2 to 5 for lead(II) and between 2 and 7.5 for cadmium(II). Higher values of pH were avoided to prevent metal ion precipitation as hydroxides. For this reason, pH 5 was selected during metal biosorption experiments.
Speciation diagram of: a) lead(II) and b) cadmium(II). The mole fractions were calculated with the HYDRA and MEDUSA software.
3.3. Biosorption of Lead(II) and Cadmium(II) in Fixed Bed Columns
The dynamic sorption performance in fixed columns was investigated in two different systems: a single-component and a two-components. Fig. 2 shows the breakthrough curves for both ions in the single-component system. The main mechanisms for removing metal ions using biosorption include physical bonding, ion exchange and complexation/chelation [29]. It has been proposed that SCB possess carboxylic acid groups, which function as exchangeable cation sites and facilitate complexation. Results showed a greater adsorption capacity for the lead, which it is can be due to a greater affinity to the SCB active sites for this ion, probably due to its the higher electronegativity and smaller hydrated ionic radii [29]. In contrast, in the two-components system, results reveal a substantial decrease in lead(II) adsorption capacity, while that of cadmium(II) did not seem to be much affected (Fig. 3). These results suggest that the cadmium( II) produced an inhibitory effect of lead(II) adsorption.

Profiles of breakthrough curves for adsorption of lead(II) and cadmium(II) in the single-component system.
Profiles of breakthrough curves for adsorption of lead(II) and cadmium(II) in the two-component system.
Table 1 shows the parameters obtained from the analysis of the experimental data presented in the breakthrough curves, for single-components and two-components with the SCB. In the single-component system, the times of rupture and saturation (tr and ts), the volume treated at rupture point (Vr), the adsorption capacity (q0), the length of unused bed (SNU) were higher for the lead(II) than for the cadmium(II). In contrast, as previously mentioned for the two-component system, data revealed a interaction between the lead and the cadmium, causing a significant decrease in all values of the variants parameters from single-component system, though some parameters were superior for the cadmium and others for the lead, as in case of rupture time, in lead (47 min) it was slightly superior than cadmium (43 min), so the volume treated for lead (76.6 mL) is superior than cadmium (70.1 mL), moreover for saturation time, the higher value registered was for cadmium, (129 min) compared to lead (88 min), that means after the rupture, the competition of the active sites by metals of concern, favored to cadmium. The adsorption capacity proved to be equal for both metals, at the no used fixed bed, cadmium reported the highest value with 18.63 cm. About the removal, the bagasse showed a higher adsorption percentage for cadmium with a removal of 92% instead of lead which showed 90%.
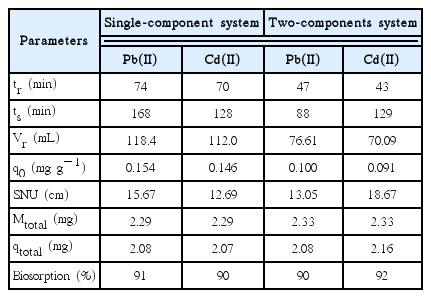
Breakthrough Curves Parameters for Biosorption of Lead(II) and Cadmium(II) in Fixed Bed Columns
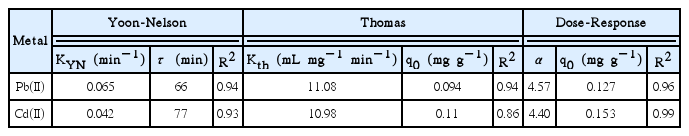
Parameters Obtained from Applied Models Based on Time in Column Filled with Sugar Cane Bagasse for Biosorption of Lead(II) and Cadmium(II). Two-components System
3.4. Rupture Curves: Adjusting Models and Determination of Kinetic Parameters
3.4.1. Single-component system
The Thomas and the Yoon-Nelson models adjusted well to the rupture curve of experimental adsorption of lead(II) and cadmium( II) (R2 ≥ 0.97). It should be indicated that the expression of the Yoon-Nelson model is mathematically equivalent to the model of Thomas. This justify the similar agrement between the experimental and simulated data for both models. In the Thomas model, the fitted maximum adsorption capacity (q0) values were close to those obtained experimentally, reflecting the consistency of the model. Accordingly, the adsorption mechanism was assumed to be a Langmuir-type sorption followed pseudo-second-order monolayer chemical sorption. Similar results have been resported by several researches studying different biosorbent-divalent metal systems in fixed bed columns [30, 31]. As it is shown in Table 2, different Thomas rate constants (Kth) were obtained for both metal ions, indicating diverse adsorption rates. A significantly higher value was obtained for the cadmium, probably due to a lesser mass transport resistance.
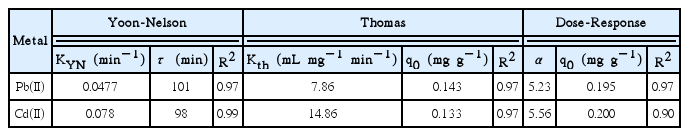
Parameters Obtained from Applied Models Based on Time in Column Filled with Sugar Cane Bagasse for Biosorption of Lead(II) and Cadmium(II). Single-component System
Regarding with the Yoon-Nelson model, as expected, the value of the time required to retain the 50% of initial metal, τ, was very similar to that obtained experimentally (Fig. 2). Also, the constant rate KYN was higher for the cadmium(II), consistently with Thomas rate constants data. Although both models reproduce the breakthrough curves for both ions, the Thomas model is preferred because it provides more information about the physical characteristics of the adsorbent (i.e. adsorption capacity).
Finally, the Dose-Response model has an allowable adjustment with cadmium experimental rupture curve, with a R2 of 0.90. However, as can be seen in Table 2, the adsorption capacities calculated were significantly higher than those obtained experimentally for the studied metals. In addition, it is difficult to assess the physical meaning of the adjustement parameter α and thus, to relate it with the operating parameters, as previously highlighted by Rodríguez Rico et al. [19].
3.4.2. Two-components system
For the two-components system, the Yoon-Nelson model and Thomas adjusted reasonably well to experimental rupture curves of lead(II) and cadmium(II) (R ≥ 0.90). About τ values in the Yoon-Nelson model, the values obtained for both metal ions were slightly higher than those value observed experimentally (Fig. 3). Regarding the adsorption capacities in the Thomas model, the experimentally obtained values were similar than those values, 0.094 mg g−1 for lead(II) and 0.11 mg g−1 for cadmium(II). Finally, the Dose-Response fitted well for both metal ions. Nevertheless, as mentioned above, the lack of physical meaning of the adjusted parameters, significantly limits its applicability to the model the column behavior and therefore the scale up of the process [19].
4. Conclusions
The experimental investigations conclude the biosorption capacity of SCB for the lead(II) and cadmium(II) ions. The biosorption of lead(II) by SCB was significantly influenced by the presence of cadmium. In single and two-component systems, Yoon-Nelson and Thomas models successfully reproduce the rupture curves, due to the equivalence of the mathematical expressions. Nevertheless, the Thomas model is preferred because it provides more information about the physical characteristics of the adsorbent. Although the Dose-Response model was the best one reproducing the experimental rupture curves in the entire measured range, the lack of physical meaning of the adjusted parameters significantly limits its applicability.
Acknowledgments
We thank the PROMETHEUS project, SENESCYT, and Center for Environmental Studies of the University of Cuenca, for the opportunity to perform this work that will bring new results, by applying it to the mining industry.
Nomenclature
C
concentration of the effluent at the column outlet (mg L−1)
C0
initial metal concentration (mg L−1)
CR
retained metal concentration (mg L−1)
H
bed height (cm)
Kth
velocity constant of the Thomas model (mL min−1 mg−1)
KYN
constant of proportionality of Yoon-Nelson (min−1)
mB
the biosorbent mass (g)
mtotal
total amount of metal passing through the column (g)
Q
flow rate through the column (mL min−1)
q0
adsorption capacity (mg g−1)
q10
adsorption capacity of the column (mg g−1)
qtotal
maximum adsorption capacity or the column (mg g−1)
Rc
the total percentage of metal retained during the operation (%)
SNU
length of unused bed (cm)
T
operating time (min)
t10
the time required to achieve an effluent concentration of 10% of the feed concentration (min)
tr
time at the rupture point (min)
ts
saturation time
ttotal
total operating time (min)
Vef
effluent volume (mL)
α
empirical parameter in the Dose-Response model
ɛ
porosity of the biosorbent
ρap
apparent density (g mL−1)
ρrel
the relative density (g mL−1)
τ
time required to retain 50% of the initial adsorbate (min)