A computational study on the removal of the non-isothermal concentrated fume from the semi-enclosed space
Article information
Abstract
For the prediction of the ventilation rate for removing the non-isothermal concentrated fume from the semi-enclosed space, the computational fluid dynamics (CFD) analysis was done. Securing the proper ventilation conditions in emergency state such as in fire is crucial factor for the protection of the resident in the space. In the analysis for the determining the proper ventilation rate, the experimental study had the limitation for simulating the versatile conditions of fume development. The theoretical and computational method had been chosen as the alternate tool for the experimental analysis. In this study, the CFD analysis was done on the defined model which already had been done the experimental analysis by the previous workers. By comparing the prediction on the plume heights and the ventilation rates by the CFD analysis at, and in the parametric model of 1 m3 with those of the previous experimental works, the feasibility of the computational analysis was evaluated. For the required ventilation rate analyzed by the CFD analysis was over predicted in 7.1% difference with that of the experimental results depending on the different plume height. With the comparison with the analytical Zukoski model at, the CFD analysis on the ventilation was under predicted in 8.3%. By the verification of the feasibility of the CFD analysis, the extended analysis was done for getting the extra information such as the water vapor distribution and CO2 distribution in the semi-enclosed spaces.
1. Introduction
The underground spaces that are used for commercial activities and subway stations are the typical type of the semi-enclosed spaces. In the semi-enclosed spaces, the ventilation system is a very important facility used for maintaining the proper air quality for the resident. In addition to this purpose, the ventilation system has another important role of removing the high quantity of smoke fume generated in semi-enclosed space in the emergency of fire so that the resident can be evacuated in proper manner without suffocation. The fire accident occurred in local subway station at Daegu, Korea on February 18th, 2003 totaled 186 casualties which were mainly caused by the suffocation before the direct exposition to the fire. In the emergency state, maintaining of higher ventilation rate for removing the high concentrated fume or hazardous gas from the semi-enclosed space is very important for minimizing the casualty by guaranteeing the normal breathing for the evacuee.
To get the meaningful data for the ventilation rate for those purposes in emergency state, the prototype experiments can be the best methods. But the prototype experiments have some limitation for getting the meaningful data in versatile situations due to the problem of repeatability of data and the difficulty in preparing the prototypes. Instead of the prototype experiment, the scaled model experiments can be alternative method for solving the problem in real situations. In scaled model experiments, the similitude between the different scaled models is very important to extend the results of analysis in prototypes or real situations. Chang et al. [1] did the scaled model experiments based on the Froude similitude to predict the ventilation rate of the non-isothermal concentrated fume from the semi-enclosed space. By selecting the n-heptane as the combustibles, the Froude similitude [2] was done to check validity the development of fume in the semi-enclosed model space. In the experiment of Chang et al. [1], the correlations between the scaled models were quite acceptable, but the detailed development of the fume with respect to the operating variables was not clarified due to the inevitable limitation in the experiments. Compare to the normal state of isothermal condition of which solution can be found easily in text [3], the non-isothermal concentrated fume has the higher degree complexity in its prediction of motion due to the additional effects of buoyancy and diffusion. The effects of buoyancy and diffusion require the higher flow rate for controlling the ventilation of fume. Lim et al. [4] applied the numerical method for describing the behavior of non-isothermal concentrated fume inside of the semi-enclosed space. The numerical results were verified by comparing with the experimental data obtained near the wall of the scaled model [1]. In the work of Lim et al. [4], it was assumed that the distribution of fume is proportional to the distribution of CO2 and water vapor. In a complete combustion, this kind of assumption can be accepted because the distribution of combustion products from the hydrocarbon based fuels resemble the development fume rise from the fire starting point. But in incomplete combustion, the unburned material such as soot resides in the space and the fume profile cannot be defined clearly. So the plume development estimation by the previous numerical method [4] needs to be improved by applying more detailed consideration on the species formed in the semi-enclosed space.
In this study, the computational fluid dynamic (CFD) method [5, 6] was used to get the reasonable results by setting up the proper dynamic and thermal conditions including the species formation by the combustion. As a rule, the feasibility of the CFD analysis should be verified. For the verification, the parametric comparison between the computational results and the experimental results on the same operational condition is often used. After the successful parametric comparison for the verification, the computational analysis can be extended to apply in more versatile situations.
2. Materials and Methods
2.1. Selection of Computational Model for the Parametric Comparison
As the reference for evaluating the feasibility of the computational analysis, the previous work of Chang et al. [1] was used. For the purpose of comparison with the previous experimental work of Chang et al. [1], the computational model was set up as shown in Fig. 1 and the calculation was done to get the comparative variables.

Schematic of the model for the parametric study.
The dimension of the model in Fig. 1 was 1 m × 1 m × 1 m same as the previous experimental work [1]. The model had the ventilation on top of the space and the opening for air supply at the bottom side. The other four sides were well insulated walls. For simulating the fume generation in the semi-enclosed space, n-heptane was selected as the fuel needed for generating the fume by the incomplete combustion. In the previous experimental work [1], the pool of n-heptane which had the evaporation surfaces of 5.3 cm to 27 cm in diameters were installed at the center of bottom side. Once the n-heptane was ignited, the fumes were formed into the semi-enclosed spaces. High carbon number of n-heptane generated large quantity soot easily, which favored the optical examination of fume propagation in semi-enclosed space.
In the combustion process of n-heptane, many different types of intermediates including ketones and aldehydes exist and complex descriptions were required in the computation process. The exact description on the intermediate reaction was very crucial to get the reasonable results from the computational analysis. Most likely semi-empirical values are adopted for the intermediate reaction to evade the error caused by uncertainty of undefined intermediate reactions [7]. In the previous experimental work [1], the equivalence ratio for the combustion which was defined as the ratio of stoichiometric air to actual air was above 1.0. In these conditions, the reaction was very unstable and there should be much quantity of soot in the semi-closed space due to the lack of oxygen in combustion. The plume developed from the pool of n-heptane includes large size of eddies caused by the strong effect of buoyancy. The pool fire flame induces air around for enhanced combustion, which results in eddies near the flame envelope. The size of eddy along the plume developed is dependent on the initial condition of fire. As described by Quintiere [8], a fire of 10 cm in base diameter results in 5 eddies in a second. But the wild land fire of 100 m in diameter forms a vortex every 10 seconds. So the initial size of the flame base is a very important parameter for analysis of the plume development. These kinds of consideration by Quintiere [8] mean the role of flow dynamics is crucial to determine the plume rise pattern though there is the effect of species formation on thermal conditions.
From the reference [1], the boundary condition for the computational analysis on the feed rate of fume into the space could be expressed in form of fuel evaporation rate. In the experiment [1], the boiling temperature of the n-heptane was measured by inserting thermocouple in the fuel pool, so the temperature of evaporating vapor near to the gas-vapor interface had minor error due to the latent heat. In the computational analysis, the evaporation temperature of n-heptane was used to remove the complexity caused by including the phase transition in gas-liquid interface.
Chang et al. [1] showed the relation between the ventilation mass flow rate and the dimensionless height of plume rise by using the experimental model. So the computational analysis was done to get the same parameters in the model for the comparison.
After the feasibility evaluation of the CFD method on the parametric model, an arbitrary geometry of semi-enclosed space was proposed for the extended application. As a testing model, a different model of semi-enclosed space in Fig. 2 was proposed for the CFD analysis in different conditions.

Schematic of the model for the extended testing.
In the proposed model, the cross sectional area for fume rise in the semi-enclosed space was 10 m × 10 m and the height of the space is 3 m. The 36 ventilation outlets from the semi-enclosed space are distributed evenly on top ceiling side and the inlet flow induced from the door. The door’s dimension is 1.2 m in width and 2 m in height. In the calculation, it was assumed that a pool for fire which had 1 m2 in area is located in the center of the bottom surface. It is assumed that the liquid n-heptane was prepared in the pool container to use the same physicochemical data in the parametric study in Fig. 1. In the extended testing analysis, the ventilation rates from the top sides were 4, 8, 12, 16 and 32 times of the 1 m3 volume case of Fig. 1. In the CFD analysis on the extended model, other operating condition such as the distribution of CO2 concentration was evaluated to predict the proper ventilation rate from the space.
2.2. Boundary Conditions for the Computational Analysis
For the computational analysis on the fume development in the targeted space, three different physicochemical considerations should be done. Those are the fluid dynamics, combustion and heat transfer. In general, fluid motion and heat transfer are coupled and considered simultaneously in the computational analysis. The heat transfer concerned in this study was between the main gas flow and side wall. In this study, the effect of unburned quantity of n-heptane as the fuel was considered by using the algorithm in the ANSYS CFX solver [9]. In the numerical calculation of the fluid dynamics, the Reynolds Averaged Navier-Stokes (RANS) turbulence model [9, 10] was used. In this study, the averaged tendency of vortex described in form of turbulent distribution along the plume was studied. As the state of the grid mapping did an important role on the sensitivity of the flow fluctuation caused by residuals originated due to the vortex, various preliminary studies were done on the grid mapping.
The flow was internal flow in semi-enclosed space, so the model was selected for describing the flow dynamics in turbulent state [9, 10]. In the turbulent model, the dynamic equations can be arranged as
where Sm denotes the body force, μe denotes effective viscosity in turbulent flow and p′ denotes the transformed pressure. The transformed pressure is defined as
μe which is used for the effective viscosity in turbulent flow in Eq. 2(a) is defined as
In Eq. (4), μt denotes turbulent viscosity and it has the relation as
In the k-ɛ turbulent model. Cμ is a constant. Dissipation parameters of the turbulent flow, k and ɛ, are defined as
where Cɛ1, Cɛ2, σk and σɛ are constants. Pkb and Pɛb reflect the effect of buoyancy. Pk reflects the increase of turbulence caused by the viscosity effect, which is defined as
For the computation of physicochemical process, we adopted the probability density function (PDF) for describing the species existence in the reaction process. Though the use of the PDF has limitation in describing the full reaction processes of the fume, it includes the thermodynamics properties of the major intermediates of the combustion reaction. Hence the results of the calculation became more realistic than that of the previous work [2]. Lim et al. [2] used the calorific heat balance and water vapor mass balance of fume generated from the n-heptane combustion in the space, hence the results had error caused by the uncertainty of the species compositions. For the adoption of the PDF function in the analysis, several assumptions should be done. One is that the computational analysis should be done under steady state. As the experiments of Chang et al. [1] were done under pseudo steady state, the assumption of the PDF under the steady state could be applied in the computational analysis and the results of the computational analysis could be evaluated by using the previous results [1]. For the physicochemical computation for the combustion of n-heptane in the air, Yoo et al. [11] summarized and proposed 58 species for the simplification in the computation. In the computation of the transport properties in multiple species, each species became a freedom of calculation. So the computation involved 58 degrees of freedom for the calculation. Each computation in different computational degree involved the calculation of the additional diffusion, the turbulent intensity and the thermal balance which required much higher quantity of computational resources.
The other assumption was about the boundary condition which described the n-heptane feed into the space. In the computation, the temperature of fume into the semi-enclosed space was corrected by referencing the boiling point of the n-heptane. In the experiment [1], the temperature of fume near the n-heptane feed surface was determined by measuring the temperature of the boiling pool of the n-heptane. The error in temperature by the latent heat across the boiling surface of n-heptane was corrected for the proper setting up of the boundary condition.
3. Results and Discussion
3.1. Evaluation of the Computational Results
The experimental results of previous work [1] were used for the evaluation of the computational results. In the experiments of Chang et al. [1], the temperature distribution at the inner points which is located 10% of full distance from the wall was measured. The full distance was defined as the distance from the wall to the center of model. So the real measured points were at 5 cm distances from the wall in the case of experimental model which had the dimensions of 1 m × 1 m × 1 m in volume. Chang et al. [1] included the errors caused by the incomplete correction of radiation effect in thermocouples and the inevitable flow disturbance in their results. Results of the computational analysis which adopted the PDF for describing the chemical species in the reaction were summarized and compared with the experiments [1] as shown in Fig. 3. In Fig. 3, the computational result which included the effect of heat loss from the wall was well fitted with the experimental results along the fume rise direction. The deviation between the computational and the experimental results became wider from 0.4 m in fume rise height. The computational analysis in Fig. 3 did not include the effect of the latent heat of water vapor in the space and the radiation between the combustion materials such as the concentrated soot was not included. Hence deviation along the fume rise height accounts for these errors.
Comparison of temperature distribution with PDF in the parametric model.
For the enhanced computational analysis, the radiation effect was included. The P1 model [9] which describes the radiation between the point soot in the fume and the wall surfaces was adopted for accounting the radiation effect from to the wall. In Fig. 4, the prediction of the computational analysis which included the modified heat transfer effect had good relation with the experimental results in case of the parametric model of 1 m × 1 m × 1 m in volume. With these results, it was validated that the basic scheme of the CFD analysis. And the computational scheme herein could be extended for the real application without much concern about the error which may be caused by the improper assumption. In the CFD analysis, the heat transfer effect did a significant role. As the temperature distribution determines the pattern of the plume rise by the diffusion and the buoyance effect on the fume motion. The finalized plume shape was very dependent on the temperature distribution.
Comparison of temperature distribution with PDF and radiation in the parametric model.
The sectional temperature distributions in the parametric model are shown in Fig. 5. For the evaluation of heat transfer effects, three different cases of the heat transfer conditions were tested by the computational method. Fig. 5(a) shows the temperature distribution in the case of no heat loss across the around wall of the parametric model. The results in Fig. 5(b) are temperature distributions in cases of heat loss across the wall by the conduction and convection. In addition to condition of Fig. 5(b), the radiation effect was included in Fig. 5(c). The combustion of n-heptane in the pool located in the bottom center provides the heat source and the resultant fume concentration and the temperature distribution in the parametric model. As shown in Fig. 5, the temperatures near the wall were lowered by addition of the heat loss effect across the wall. The average temperature in Fig. 5(b) is lower than in Fig. 5(a). In the case of the Fig. 5(c), the radiation loss from fume and soot to wall even lowered the temperature in the zone.
Temperature distributions in the parametric model predicted by the CFD analysis.
(a) without wall heat loss, (b) with wall heat loss by the conduction and convection, (c) with wall heat loss by the conduction, convection and the radiation
3.2. The Prediction of the Plume Height
By the role of buoyancy caused by the temperature difference along of the fume rise, the fume generated by the n-heptane formed the thick fume layer. Defining the plume height, which is the location of fume layer as shown in Fig. 6, is not easy as the interface formed by the fume is not clear.
Variables in the parametric model.
Chang et al. [1] defined the location of the plume height by measuring the attenuation of light which across the fume along the plume rise. By measuring the attenuation of light by the fume layer with respect to the plume rise height, the inflection points where the high concentration fume layer begins could be found. Chang et al. [1] compared their experimental results on the plume height with the prediction of previous workers [9, 12, 13]. Using the Zukoski plume model [13], the exhaust mass flow, ṁe, to the top side vent is defined as
And ṁp which is the mass flow of fume into the space and ṁ which is the mass feed rate from the n-Heptane pool is expressed as [12]
where Q̇ is the heat supply into the space by the n-Heptane. ρa is density air supplied for the fume generation and Cp and Ta are the specific and the temperature of supplied air respectively. The plume height, z, in Eq. (10) was calculated once all the experimental values are given. Chang et al. [1] did the analytical prediction by using the Eq. (10) to check the validity of their experimental results. Though there was some uncertainty on determining the location of fume layers for checking the plume rise heights, the comparison of the dimensionless plume heights determined by the experiments with the analytical prediction in the parametric model was successful. In the case of the parametric model, Chang et al. [1] found that the location of fume layer interface that is the plume height was 0.4 in dimensionless value. In the parametric model, the dimensionless height, z*= z/H = 0.4 is 0.4 m in height from the bottom. Using the Eq. (10), the predicted plume height, z, was found to be 0.44 m when the exhaust mass flow, ṁe was 0.026 kg/s. The uncertainty on determining the interface of fume layer in the experiments could the reason of the difference in heights.
In the prediction of plume height by using the CFD method, the uncertainty on determining the interface of fume layer could be minimal, and the resultant improvement in prediction will leads to the correct ventilation rate, ṁe, in Eq. (9). The experimental works of Chang et al. [1] were to validate the plume rise model based on the Zukoski model [13], which lead to the prediction of ventilation rate, ṁe, in case of fire in semi-enclosed space. In our study, the plume height z, and the ventilation rate, ṁe, were determined directly by the CFD algorithm discussed in section 3.1. In the CFD analysis on the parametric model, the plume height was determined by checking the distribution of water vapor. As the water vapor contaminated by the fume will do a dominant role to attenuate the intensity of monitoring light used in the experiment of Chang et al. [1], so the distribution of water vapor concentration in the space would proportional to the fume concentration to determine the location of the fume layer interface or the plume height.
In Fig. 7, the water vapor fraction in the parametric model by the CFD analysis is shown. In the parametric model, the fume layer interface is located near 0.42 m which is the inflection point of water vapor concentration along plume rise direction. At the inflection point of 0.42 m the water vapor fraction in the space was 0.004. The predictions of the plume heights by the CFD were 4.5% lower than the result of the Zukoski model in Eq. (10), and 4.7% higher that of Chang et al. [1]. On the various plume heights, the ventilation rates predicted by the CFD analysis were several summarized in Table 1 for the comparison with the previous works [1]. As shown in Table 1, the results of the CFD analysis on the exhaust mass rates had the 5–33% difference with the experimental results [1] on different conditions. But the difference between the CFD analysis and the Zukoski model [1] on the prediction of the exhaust mass rates were between 3% and 9%. The main cause of the error in the comparison was assumed to be the uncertainty from the determination of fume layer location. At the condition of z*= z/H = 0.4, the exhaust mass rate of the CFD analysis was 7.1% higher than the experimental result. And the CFD analysis showed 8.3% under predicted values compared with the results of the Zukoski model.
The water vapor fraction in the parametric model by the CFD analysis.
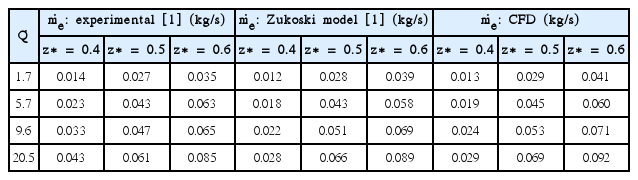
Comparison of the Mass Flow Rate with Respect to the Plume Height
3.3. Prediction of the Ventilation Rate Based on the Average CO2 Concentration
The CFD analysis in sections 3.1 and 3.2 were the trials for the validation of the computational analysis in a limited space which is described in section 2.1. By the comparison with the plume heights derived by the analytical [13] and experimental methods [1], it was verified that the CFD analysis could be applied in real situation under certain conditions. The CFD conditions described in section 2.2 were selected for the analysis of the extended cases.
In real situation, the flow in semi-enclosed space is not simple as shown in Fig. 2 due to the furniture and others stuff. So the distribution of fume concentration entrained in the flow may not axisymmetric along the plume rise direction. But in wider cross sectional space, the flow along the plume rise direction could be simplified as the pseudo axisymmetric flow and it could be assumed similar to the case of the parametric model in Fig. 1. As described in section 3.2, the successful computational prediction of the plume height and ventilation rate validated the use Eq. (10) for the prediction of ventilation rate based on plume rise height. But in real situation, the required ventilation rate should not be decided by the plume rise height. For the practical purposes, the required ventilation rate should be decided on the condition of air quality in the space. Though the required ventilation rate was determined by the plume rise height and targeted to move up the fume interface up to the vent, the control of fume concentration with respect to the air quality in the semi-enclosed space is more meaningful. The CO2 concentration reflects the combustion process in the space. In the case of enclosure fire, the increase of CO2 concentration reflects the depleting of oxygen in limited space by the trade-off relation. Many kinds of harmful substances produced by the burning mass in the space can be concerned. So species oriented analysis are required to evaluate the toxic effects of each combustibles in gaseous and particle phases. In our study, the various toxic combustibles including CO and other toxics were included in form of the fume. So controlling of the fume means the control of various toxic combustibles in the analysis. For estimating the burning process in the oxygen limited semi-enclosed space, the concentration and distribution of CO2 could be an important indicating parameter for the evolution of the fire process and toxic materials. Instead of dealing with each toxic material, the analysis of CO2 concentration which has the information of oxygen depleting in the space by the fire process has the important meaning and it can be an important parameter for understanding the propagation fire in the semi-enclosed space. Under the transient and hyperventilation state of fire in the semi-enclosed space, the concentrations of CO and other related combustibles does not provide the reasonable information of fire process. Instead the CO2 concentration shows more meaningful air quality index because of that burning progress is propositional to the generation of CO2 [14]. At the below condition of 4% concentration of CO2 in the air, people do not be suffocated in short term exposition [15] so people can leave from their emergency place for safe breathing. The enclosure space in fire is being filled with the combustibles including the CO, CO2 and soot as the fire. In the CFD analysis, the ventilation rates were controlled to check the average concentration of CO2 in the space. In Fig. 8(a), the ventilation rate was 4 times higher than the condition of z*= z/H = 0.4 described in section 3.2. In this condition of ventilation rate, the average concentration of CO2 in the space was 10%. As the condition of 10% CO2 in concentration, the air quality is in unsuitable and causes the suffocation. In Fig. 8(b), it was found that the average concentration of CO2 becomes 4.0% when the ventilation rate was 32 times higher than the condition of z*= z/H = 0.4. The CFD prediction showed the average concentration of CO2 in the space was 3.8%. For maintaining the CO2 condition in Fig. 8(b), the required ventilation rate from the 300 m3 was 6.4 kg/s. The predicted flow rate for maintaining the proper CO2 concentration in the space was almost twice than that of the parametric study of which had the volume of 1 m3 and it requires the high capacity of air remover. In this study, the main concern was to estimate the required ventilation rate with respect to the plume height. But for the real situation, versatile combustibles are generated which may cause the deterioration of the mobility of the resident even though the required plume height was defined. The analysis on the distribution on the CO2 concentration in the space was for the extra concern to minimize the casualty.
Distribution of CO2 concentration in the extended model. (a) 4 times of the parametric flow (b) 32 times of the parametric flow
4. Conclusions
The comparison of the computational results with the previous experimental results and the analytical results on the parametric model was successful; herein the computational method evaluated in this study can be applied more versatile conditions of different heat loadings and different geometries. For the proper determination of the removal rate of non-isothermal concentrated fume from the semi-enclosed space for maintaining the air quality in fired conditions, the method of computational analysis could be a feasible tool for understanding the complex fire condition. In this study, there were some difference in predicting the location the fume layers between the previous experiments and the computational analysis. This difference might be caused by the uncertainty of locating of the inflecting point of light attenuation in the experiment. As the computational results with the analytical Zukoski model showed less difference in locating the plume height, the prediction of computational results can be trustable. The air quality condition in fire state had been defined in term of the plume heights, but in real situation the composition of combustibles can be determinative factor for breathing so the distribution of CO2 concentration was analyzed. Using the computational method, more versatile information can be obtained. In our testing model of 300 m3 semi-enclosed space, the required minimum ventilation rate was found to be 6.4 kg/s to maintain the CO2 concentration in 3.8% below.