Study on the response surface optimization of online upgrading of bio-oil with MCM-41 and catalyst durability analysis
Article information
Abstract
Direct catalysis of vapors from vacuum pyrolysis of biomass was performed on MCM-41 to investigate the effects of operating parameters including catalyzing temperature, catalyzing bed height and system pressure on the organic yields. Optimization of organic phase yield was further conducted by employing response surface methodology. The statistical analysis showed that operating parameters have significant effects on the organic phase yield. The organic phase yield first increases and then decreases as catalyzing temperature and catalyzing bed height increase, and decreases as system pressure increases. The optimal conditions for the maximum organic phase yield were obtained at catalyzing temperature of 502.7°C, catalyzing bed height of 2.74 cm and system pressure of 6.83 kPa, the organic phase yield amounts to 15.84% which is quite close to the predicted value 16.19%. The H/C, O/C molar ratios (dry basis), density, pH value, kinematic viscosity and high heat value of the organic phase obtained at optimal conditions were 1.287, 0.174, 0.98 g/cm3, 5.12, 5.87 mm2/s and 33.08 MJ/kg, respectively. Organic product compositions were examined using gas chromatography/mass spectrometry and the analysis showed that the content of oxygenated aromatics in organic phase had decreased and hydrocarbons had increased, and the hydrocarbons in organic phase were mainly aliphatic hydrocarbons. Besides, thermo-gravimetric analysis of the MCM-41 zeolite was conducted within air atmosphere and the results showed that when the catalyst continuously works over 100 min, the index of physicochemical properties of bio-oil decreases gradually from 1.15 to 0.45, suggesting that the refined bio-oil significantly deteriorates. Meanwhile, the coke deposition of catalyst increases from 4.97% to 14.81%, which suggests that the catalytic activity significantly decreases till the catalyst completely looses its activity.
1. Introduction
With the increasing of environmental problems and energy crisis, people pay more attention to the utilization of pyrolytic conversion of biomass. However, bio-oil usually presents several disadvantageous characteristics, such as high water and oxygen content, corrosiveness [1–2], instability under storage and heating conditions, immiscibility with petroleum fuels, high acidity, high viscosity, and low calorific value [3–4]; all these become the primary obstacles for its direct application as a fuel and need for further purification. Therefore, how to overcome these drawbacks and obtain high-quality liquid fuel has become a research hotspot. Currently, the main methods for upgrading bio-oil are catalytic hydrogenation [5], catalytic esterification [6], catalytic cracking [7], wherein the catalytic cracking has been widely used for its simple equipment requirements, safety, and good upgrading effect [8]. In the catalytic cracking technology, the selection of catalyst is critical. Several types of materials such as metal catalyst [9], Y zeolite [10], β-type zeolite [11], ZSM-5 zeolite [12] have been studied as catalysts for biomass pyrolysis or for the upgrading of bio-oil. Most of the catalysts are microporous materials with pore diameter of 0.3–1.0 nm, which make larger molecules difficult to enter the inner pores with catalytic activity and hamper the further catalytic and cracking reaction of macromolecules in the hole, limiting the catalytic cracking of intermediate oil, heavy oil and adsorption and separation of macromolecular substances [13]. Fan [14] conducted the online catalytic upgrading of pyrolytic vapors with HZSM-5 zeolite, the result showed that the use of HZSM-5 caused a remarkable increase of the desirable compounds including aromatic hydrocarbons, light phenols and alcohols, and a significant decrease of the unstable and corrosive compounds. The MCM-41 is the main representative of the mesoporous molecular sieve of M41S family, which was discovered in 1992, and possesses a hexagonal array of uniform mesopores whose dimensions can vary from 1.5 nm to 10 nm in size and exhibits high surface areas [15]. Some formal studies had been conducted, Chang et al [16] used the MCM-41 zeolite as catalyst and chlorella as raw materials in the horizontal tubular resistance furnace to upgrade the refined bio-oil, the results showed that the yield of upgraded bio-oil had decreased 7.06% and the high heat value has increased to 31.224 MJ/kg compared to the raw bio-oil. Besides, the aliphatic hydrocarbons, alcohols and nitrogen compounds had significantly increased, while the contents of phenols and carbonyl compounds had decreased after catalytic upgrading of bio-oil. Li [17] performed the experiment of hydrogenation of naphthalene on the high-pressure micro-reactor with MCM-41 molecular sieve of different silica to alumina ratio synthesized by hydrothermal methods, the results indicated that with the decrease of n(SiO2)/n(Al2O3), the aluminum content of MCM-41 had increased and the ring-open activity had enhanced. Käldström [18] had conducted the catalytic pyrolysis of levoglucosan with MCM-41 in a fixed bed reactor, the results showed that the liquid products included some oxygen-contained compounds (ketones, furans and acids), and the content of each component changed with the holding time. Besides, the MCM-41 zeolite had a promoting effect on the main component of liquid products (excluding acetic acid). Few researches on the online catalytic upgrading of vacuum pyrolysis vapors of biomass with MCM-41 zeolite had been conducted home and abroad, relevant reports have not analyzed the impact of process parameters on the product yield of organic phase, or optimized the process parameters with a more scientific approach. Therefore, the MCM-41 mesoporous molecular sieve was chosen as catalyst to online upgrading of vacuum pyrolysis vapors generated by biomass in a two-stage reactor. Taking the organic phase in refined bio-oil as goals and optimize the preparation conditions of the organic phase with response surface methodology based on single factor experiments, and analyzing the durability of catalyst in regard of bio-oil quality and catalyst coking rate in optimum conditions. The objectives of this study are to provide reliable theoretical and experimental basis for the efficient conversion and utilization of biomass and further modification of MCM-41 molecular sieve.
2. Experimental Materials and Methods
2.1. Experimental Materials
2.1.1. Biomass
The rape straw from rural area of China was used as experimental material. The biomass was ground and sieved for small particles in the 100–150 μm range. The biomass sample was dried at 105°C for 2 h to remove external moisture. The ultimate analysis of the dried sample was carried out in an elemental analyzer (Model: FLASH1112A, Italy). The proximate analysis was performed according to ASTMD-2974 using a thermo-gravimetric analyzer (Model: TGA/DSC 1, Swiss) for determination of moisture, volatile matter, fixed carbon and ash content in rape straw. The calorific value was determined by using a bomb calorimeter (Model: ZDHW-5G, China). The results of ultimate, proximate and calorific values analysis of rape straw are shown in Table 1.

Ultimate and Proximate Analysis of Rape Straw
2.1.2. Catalyst
Domestic and international research of MCM-41 zeolite in the catalytic upgrading of biomass showed that low silica to alumina ratio of catalyst has a regulatory effect on the aldehydes and acids in bio-oil, and can improve the high value-added aromatic compounds yield [19–21]. The MCM-41 zeolite with the silicon-to-aluminium molar ratios Si/Al = 20 was used as catalyst on online upgrading of bio-oil in the experiment. The MCM-41 zeolite was ground and sieved to a particle size of 0.9–1.6 mm, dried at 105°C for 2 h to remove moisture and kept in a desiccator for the experiments. The pore structure characteristic parameters of the MCM-41 catalysts are analyzed with the ASAP 2020 V4.01 analyzer and the results are listed in Table 2.

Pore Structure Characteristic Parameters for MCM-41
2.2. Experimental Equipment and Processes
Vacuum pyrolysis of rape straw and online catalytic upgrading of pyrolytic vapors was conducted in a fixed-bed reactor as shown in Fig. 1. The experimental system was consisted of an electronic controller, a catalytic reactor, a pyrolysis reactor, a vacuum pump, a condensate trap, a gas collector, a nitrogen cylinder and other components. The pyrolysis reactor and the catalytic reactor were arranged into two-stage: Biomass pyrolysis reactor located in the lower section and the catalytic reactor in the upper. The electronic controller includes three sensors, which were connected to the upper, lower and central thermocouples in the blind tube of furnace, to controlling and monitoring the temperature of all parts in the pyrolysis furnace. During experiments, the whole system was in a negative pressure under the action of vacuum pump and system pressure can be adjusted by shutoff valve 2. The condensation temperature was set at −20°C (the cooling medium: ethylene glycol) for all experiments.
Schematic diagram of vacuum pyrolysis and catalytic upgrading system.
Previous research showed that when the pyrolysis temperature was 494.0°C, heating rate was 18.4°C/min, system pressure was 5.0 kPa and holding time was 60.0 min pyrolysis run produced more condensable matter, less charcoal and less gas than other runs [22]. So these conditions were adopted as the preparation of raw bio-oil and the pyrolytic vapors for upgrading. When the catalytic upgrading experiments were conducted, the MCM-41 zeolite was conditioned before performing the upgrading runs by heating at 550°C for about 1 h. The pyrolysis temperature of the lower reactor was controlled to T1 (T1 = 494.0°C), and temperature of the catalytic reactor was controlled to T2 by the electronic controller. Pyrolytic vapors were formed through pyrolysis of rape straw in the lower reactor and were quickly withdrawn through catalytic upgrading. The catalytic vapors were extracted rapidly and cooled down through a condensed collection system, and the liquid products obtained after sufficient cooling was upgraded bio-oil. When experiment was completed, the protective gas (N2) was introduced into the reactor to ensure the yields and properties of the products and catalyst will not change in the air atmosphere. The bio-oil collected was then removed and weighed when the reactor was cooled to room temperature. The upgraded bio-oil obtained by using MCM-41 zeolite consisted of oil and aqueous layers. The upper layer is oil phase product and the lower layer is aqueous phase product. The organic phase products were obtained by extracting and separating the upgraded bio-oil with methylene chloride (CH2Cl2), the condenser was cleaned with (CH2Cl2) and the washings were heated at 42°C for CH2Cl2 evaporation. The total organic products included the organic phase from upgraded bio-oil and the weight of the washings evaporation residues. It should be noted that the organic phase yields were calculated from the product weights divided by feedstock weight (air-dry basis).
2.3. Experimental Methods
2.3.1. Single factor experiment
Of all the process parameters affecting the product yields, three main factors were selected for further discussion. The experiments were conducted in batch runs with variable catalyzing temperature (400, 450, 500, 550 and 600°C), catalyzing bed height (1.5, 2.0, 2.5, 3.0 and 3.5 cm) and system pressure (5, 10, 15, 20 and 25 kPa). Every experimental run was repeated for more than three times under the same condition to get the average results and ensure the accuracy and reliability of data.
2.3.2. Response surface methodology (RSM)
RSM was used to help in finding out the optimal condition (maximum organic phase yield). In this method, the response is influenced by several variables and the objective is to optimize this response. RSM not only defines the relation between parameters and responses but can also estimate the effects of individual parameters and the interaction of parameters on each of the response variable [23–25]. On the basis of the single factor experiment, optimization for the maximum organic phase yield was analyzed by employing Box-Behnken design (BBD) in RSM using Design-Expert software (StatEase, USA). Three independent variables at three levels (33) were adopted for RSM. These three independent variables were the catalyzing temperature (°C), catalyzing bed height (cm) and system pressure (kPa), which were labeled as x1, x2 and x3. Each variable was coded at three levels: −1, 0 and +1. The parameters and their levels were presented in Table 3.
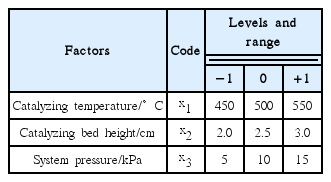
Levels and Code of Variables Chosen for BBD
The relationship between response and the selected factors solved with RSM is generally expressed with the following second-degree polynomial equation that is given as Eq. (1):
Where Y is the predicted response (predicted maximum organic phase yield), xi, xj are the independent variables in coded levels, α0, αi, αii and αij are regression coefficients for the intercept, linear, quadratic and interaction coefficients respectively, k is the number of factors (independent variables).
2.4. Characterization
2.4.1. Physicochemical characterization
The organic phase was obtained from experimental conditions that gave the maximum yield. The density of the organic phase was measured using 10 mL picnometer (ASTM D-369); the pH value was determined by a digital pH meter (GB/11165-2005); the dynamic viscosity was determined by capillary viscometer (GB/265-1988); the calorific value was determined by the ZDHW-5G bomb calorimeter (GB/T384-1981); the element contents were determined by the EA3000 elemental analyzer (GB/T19143-2003).
2.4.2. Chemical composition characterization
FT-IR (Fourier transform infrared) spectroscopy (Thermo NicoletiS5, Swiss) was applied to characterize chemical functional groups in the organic phase. The wave number scan range was 4,000–400 cm−1 with a resolution of 0.1 cm−1.
The composition of the organic phase was analyzed using gas chromatography/mass spectrometry (GC/MS) (Agilent 7890 series GC with a 5975 MS detector). Dichloromethane (CH2Cl2) was used for extraction and the extraction sample was subjected to the analysis. A total of 1 μL of sample was injected into the injection port set at 250°C in a splitless configuration. The column was operated in a constant flow mode using helium as the carrier gas. The column temperature was initially maintained at 40°C for 2 min, then programmed to increase to 100°C at 20°C/min and then to 250°C at 10°C/min. Setting the solvent delay time for 3 min. The mass spectrometer ion source was at 250°C with 70 eV ionization potential, and the 30–500 m/z range was scanned every second. The identification of the peaks in the chromatogram was based on the comparison to the standard spectra of compounds in the National Institute of Standards and Technology (NIST) library.
2.4.3. Deactivated catalyst characterization
The deactivated MCM-41 catalyst sample of (5 ± 0.1) mg was subjected to thermo-gravimetry (TG) using a TGA/DSC 1 mettler Toledo at a gas flow rate of 50 mL/min. The sample was heated from 40°C to 800°C at the heating rate of 10°C/min and was characterized by thermo-gravimetric profiles (under air flow).
3. Results and Discussion
3.1. Catalytic Effects on the Organic Phase Yield
3.1.1. Effect of catalyzing temperature on productivity
The experiments were carried out at catalyzing temperatures ranging from 400°C to 600°C, with the catalyzing bed height of 2.5 cm and the system pressure of 15 kPa. As the results shown in Fig. 2(a), the yield of organic phase presents a first rise and then a decrease tendency as the catalyzing temperature increases and reaches the maximum when the catalyzing temperature is about 500°C. It is generally assumed that the catalytic activity of MCM-41 zeolite was lower when catalyzing temperature was low and part of acid sites was not activated. The acids, aldehydes and ketones in pyrolytic vapors of rape straw have not been completely transformed into hydrocarbons. The near-water groups in these substances are more soluble in aqueous phase, which lowered the amount of extraction with dichloromethane and led to the lower product yield of organic phase. With the increase of catalyzing temperature, the activity of catalyst has increased, which promote the generation of hydrocarbons and increase the dichloromethane extraction phase to certain extent, and leading to the increase of organic phase yield. When the catalytic temperature increases further, the secondary cracking of pyrolytic vapors has exacerbated and more organic macromolecules cleaved into small non-condensed molecule gas. Simultaneously, condensation reaction has occured between some aromatic compounds and coke has formed, which led to the decrease of organic phase yield and the increase of non-condensed gas yield.
The influence of different single factors on the organic phase yield. (a) effects of catalyzing temperature on organic phase yield; (b) effects of catalyzing bed height on organic phase yield; (c) effects of system pressure on organic phase yield.
3.1.2. Effect of catalyzing bed height on productivity
The experiments were carried out at catalyzing bed height ranging from 1.5 cm to 3.5 cm, with the catalyzing temperature of 500°C and the system pressure of 15 kPa. As the results shown in Fig. 2(b), the yield of organic phase presents a first rise and then a decrease tendency as the catalyzing bed height increases and reaches the maximum when the catalyzing bed height is about 2.5 cm. It is generally assumed that when the catalyzing bed height is lower, the acid sites provided by catalyst are fewer and catalytic effect is insufficient. The acids, aldehydes, ketones and other oxygen-contained compounds in pyrolytic vapors could not be effectively catalyzed and dissolved more in the aqueous phase, which lowered the dichloromethane extraction phase and thus led to the lower yield of organic phase. When the catalyzing bed height is higher, the numbers of active sites in catalyst have increased, these acidic sites will cause excessive catalytic cracking of pyrolytic vapors and produce more gas and water, as well as excessive polymerization and formed more coke, which lowered the organic phase yield.
3.1.3. Effect of system pressure on productivity
The experiments were carried out at system pressure ranging from 5 kPa to 25 kPa, with the catalyzing temperature of 500°C and the catalyzing bed height of 2.5 cm. As the results shown in Fig. 2(c), the organic phase yield decreased with the increase of system pressure. It is generally assumed that with the increase of system pressure, differential pressure between inside and outside has decreased. The residence time of pyrolytic vapors produced by the cracking of biomass inside the reactor has prolonged, which increased the probability of excessive catalytic cracking and secondary cracking. Moreover, some organic pyrolytic vapors poly-condensated into coke in the pipeline, thus led to the decrease of organic phase yield. With the increase of system pressure, the boiling point of organic matter has increased and the precipitate rate of pyrolytic vapors has decreased, which also led to the increase of excessive catalytic cracking and secondary cracking and lowered the organic phase yield.
3.2. Optimization of the Organic Phase Yield
3.2.1. Model establishment and significance test
For the full factorial experiments, we should vary a single factor at one time. This is not always feasible because the total number of experiments will be unacceptable as the number of factors and the number of levels for each factor increase. The significant factors screened in a fractional factorial design were investigated by using BBD for optimization. Hence, 15 runs were required to be investigated in our case. The tabulated experiments and experimental results are given in Table 4.
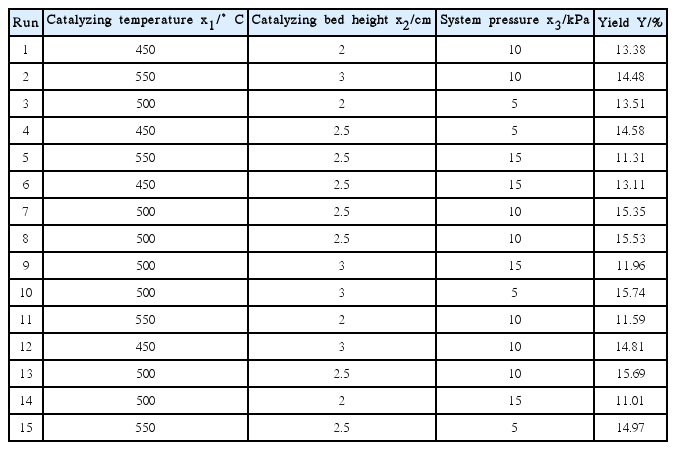
Design Matrix Using BBD and Experiment Results
A regression analysis was conducted and made by using coded values and expressed by Eq. (2):
Analysis of variance (ANOVA) for the model was performed and the results are shown in Table 5. The statistical analysis indicated the proposed model was highly significant, possessing a very low P-value (p = 0.0003) and a very high F-value (F = 47.96). Lack of fit test suggests a quadratic model with F-value of 4.50 and P-value of 0.1871 (> 0.05), which showed that lack of fit was not significant. The coefficient (R2) was 0.9885 and showed that 98.85% of the total variation in the organic phase yield was attributed to the experimental variables studied [26]. In this study, it indicated a high degree correlation between the observed and the predicted values.
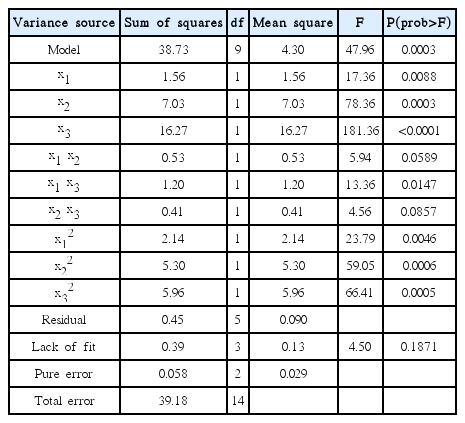
ANOVA Results for the Quadratic RSM Model for Parameter Optimization
The coded values of x1, x2 and x3 represented catalyzing temperature, catalyzing bed height and system pressure. It can be seen from Table 5 that x1, x2 and x3 were significant with P-value < 0.05. Interactions terms of x1 x3 was significant with other terms remained not significant. The result of analysis seemed to suggest that organic phase yield was affected by all quadratic terms with P-value < 0.05. Therefore, every factor and their interaction were analyzed and higher oil phase yield could be obtained by using RSM.
3.2.2. Interaction between factors
For a better explanation of the independent variables and their interactive effects on the organic phase yield, the response surface and contour plot are represented in Fig. 3. Contour shape reflects the intensity of the interaction and the ellipse indicates that the interaction of the two factors is significant while the circle indicates that the interaction is not significant [27]. The optimal value of independent factors and their interactions can be understood easily by using response surface and contour plot when the contour is ellipse. The central ellipse in the contour plot represents the highest predicted value for the response value.

Response surface and contour plot to show the effects of all factors on the organic phase yield. (a) effects of system pressure and catalyzing temperature; (b) effects of catalyzing bed height and catalyzing temperature; (c) effects of system pressure and catalyzing bed height.
It can be seen in Fig. 3(a) that with the increase of system pressure, the yield of organic phase has increased gradually. The catalyzing temperature has a significant effect on the yield of organic phase and it reaches the maximum at catalyzing temperature of 500°C. Projection of three-dimensional map in the bottom shows that the interaction between system pressure and catalyzing temperature is significant. Many reasons could be used to explain such significant interactions. When the catalyzing temperature is too low, the active sites of MCM-41 catalysts have not been fully activated. The pressure difference between inside and outside of reactor has reduced with the increasing of system pressure, which means that the reaction time between pyrolytic vapors and catalyst has expanded, which partially compensate for the inadequacy of the catalysis caused by less active site. When the catalyzing temperature increases, the active sites on catalyst have gradually increased, and the boiling point of organic compounds have increased with the increase of system pressure. Thus, the precipitation rate of pyrolytic vapors has reduced, resulting in the reduction of ultimate yield of organic phase.
3.2.3. Optimization of parameters and experimental verification
Optimization analysis was conducted to determine the optimal conditions of organic phase yield. The results from the software suggested the optimal conditions can be attained at catalyzing temperature of 502.7°C, catalyzing bed height of 2.74 cm and system pressure of 6.83 kPa and predicted organic phase yield was 16.19%. Taking the precision and reliability of experimental instruments into consideration, confirmation runs were conducted with catalyzing temperature of 502°C, catalyzing bed height of 2.7 cm and system pressure of 7 kPa. Every run has been conducted for more than three times to get average results and gave 15.84% of organic phase yield. The error between the predicted and the actual values was 2.16%, which indicated that the experimental values obtained were in good agreement with the values predicted from the models. Therefore, RSM is a useful tool for optimizing the operation parameters of MCM-41 online upgrading of rape straw.
3.3. Physicochemical Characterization of Organic Phase
The calorific value of organic phase is determined by the oxygen content and the lower oxygen content is, the higher the calorific value is [13]. Therefore, reducing the oxygen content in organic phase is an important way to increase the calorific value. The organic phase of bio-oil obtained from the optimal conditions was analyzed and the physiochemical properties of organic phase are listed in Table 6. Previous study [28] on raw bio-oil and other researchers’ study [29] on diesel oil properties are also listed in Table 6 to make comparisons.
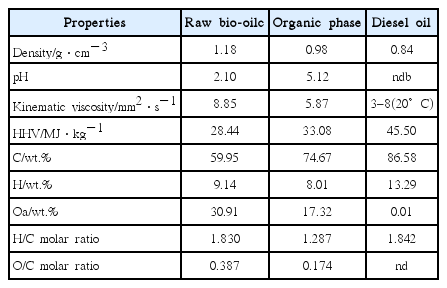
The Physiochemical Properties of Organic Phase
It can be seen from Table 6 that the density of oil phase was lower than water with 0.98 g/cm3, which was closing to low-volatility fuel. The pH value of organic phase was 5.12 that were higher than that of raw bio-oil (dry basis), which indicates that the content of carboxylic acids had significantly decreased and can reduce the corrosion of the equipment. The kinematic viscosity of organic phase was 5.87 mm2/s, which was in the kinematic viscosity range of diesel (3–8 mm2·s−1). It is mainly for the reason that after upgrading, the original macromolecular chains in organic phase have shortened significantly thus leading to the reduction of heavy components. Simultaneously, the higher heat value of organic phase had increased, with a value of 33.08 MJ/kg while the HHV of raw bio-oil (dry basis) was 28.44 MJ/kg. An amount of 8.01% of H and 17.32% of O were detected in the organic phase and the carbon content of the organic phase increased as high as 74.67%. The H/C, O/C molar ratios of the organic phase were 1.287 and 0.174, respectively. As the MCM-41 zeolite has a large surface area and pore size, which allowed larger substances to enter the pore and shape selective catalysis were conducted in the internal pore. The resulting products were easy to detach from the main channel, which reduced the re-cracking reaction of intermediate products [30].
3.4. Chemical Composition Characterization of Organic Phase
3.4.1. FT-IR analysis
The functional groups in the organic phase was measured with FT-IR in order to speculate the species of compounds the organic phase may contain and the IR (Infrared) spectrums of organic phase are shown in Fig. 4. It can be seen from Fig. 4 that the absorption peak in the range of 3,600–3,200 cm−1 corresponded to alcohols or phenols with the stretching vibration of the -OH bond, and the peak was wide and intense indicating that the content of hydroxyl group-containing organics were higher. The vibration absorption peaks in 2,949.3 cm−1 were the stretching vibration of -OH, it differed from the stretching vibration in 3,390.9 cm−1, which were caused by the O-H stretching vibration of carboxylic acids. A sharp absorption peaks at 1,700.7 cm−1 were observed which were the stretching vibration of C = O, which indicated the presence of ketones, aldehydes, carboxylic acids, esters and other substances in organic phase. It is assumed that the electronegativity of C and O had a large difference which caused great change of dipole moment when the C = O bond vibrated, and thus leading to the significant characteristic absorption peak. The vibration absorption peaks within the range of 1,300–1,000 cm−1 were the absorption peaks of the skeleton structure of the aromatic substances. Absorption peaks caused by the vibration of di-substituted aromatic hydrocarbon groups (755.2 cm−1) indicated the presence of aromatic substances in organic phase.
IR spectrums of the organic phase.
3.4.2. GC-MS analysis
The infrared spectroscopy can only detect the composition of functional groups in organic phase, in order to explore the composition of organic phase in upgraded bio-oil, further analysis were conducted with GC-MS to explore the chemical composition of organic phase. Fig. 5 shows the total ion chromatogram (TIC) of the organic phase in refined bio-oil. The mass spectra would be obtained by scanning the peaks in Fig. 5 according to the retention time, and then the corresponding compounds were identified by comparison with the NIST library. Simultaneously, the relative content of compound was preliminarily calculated by using the peak area normalization method. It should be noted that although the peak areas are not directly related to specific concentrations, the peak area still reflects the distribution of the organics in the products to some extent. 34 main compounds were detected by GC/MS and are listed in Table 7, the total peak area of quantitated compounds was 82.78% and represented the most of typical components that exist in the refined bio-oil.
GC-MS total ion current spectra of the refined bio-oil.
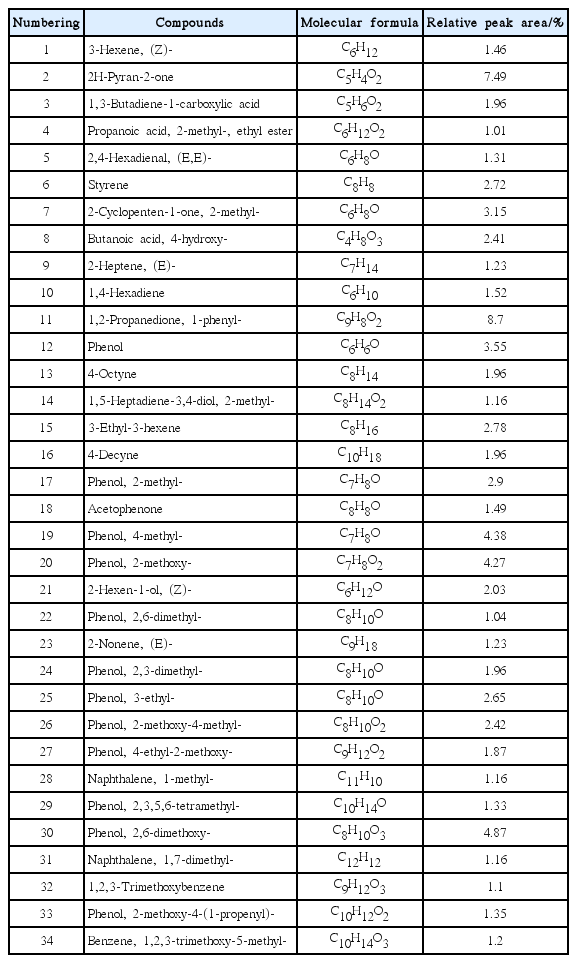
Composition Analysis of the Organic Phase in Bio-oil
The most representative organic compounds of the organic phase in refined bio-oil can be classified in 7 major functional groups: Hydrocarbons (aliphatic hydrocarbons and aromatic hydrocarbons), alcohols, acids, aldehydes, ketones, oxygenated aromatics and other compounds. Among them, hydrocarbons and alcohols are considered as desirable products for bio-fuels production, while oxygenated aromatics are also regarded as high added value chemicals. On the other hand, carboxylic acids are responsible for the corrosiveness and thus considered undesirable. The same stands for ketones and aldehydes, which are related with the instability of the bio-oil during transport and storage. The above classification in desirable and undesirable compounds has been adapted here in order to evaluate our results, taking the raw bio-oil as comparison and the classification results are shown in Fig. 6.
Distribution of different components in the bio-oil.
As it can be seen in Fig. 6, the peak area of hydrocarbons (aliphatic hydrocarbons and aromatic hydrocarbons) and alcohols in organic phase has obviously increased compared with raw bio-oil (dry basis) [29]. Among them, the content of hydrocarbons in organic phase had increased from 0.5% to 23.42%, and alcohols had increased from 4.04% to 7.03%, while the oxygenated aromatics and carbonyl compounds had decreased. It is assumed that MCM-41 zeolite has large pore size and specific surface area, which favored the depolymerization of macromolecules and deacidification of macromolecular fatty acids, accompanied with series of dehydration and carbonyl reactions, thus leading to the reduction of some oxygenated contents.
The increase of hydrocarbons can significantly improve the calorific value of oil and is favorable to improve the use of bio-oil (the main components of gasoline is C7-C11 of alkanes and the main component of diesel is C15-C18 of alkanes). The most important substances in gasoline and diesel are hydrocarbons, which mean that the quality of bio-oil mainly depends on the content of hydrocarbons [31]. It can be seen in Fig. 6, the hydrocarbons can be classified into aliphatic hydrocarbons and aromatic hydrocarbons and the main hydrocarbons in organic phase after upgrading with MCM-41 zeolite are aliphatic hydrocarbons. It is assumed that the weak acidity and large pore size of MCM-41 zeolite is more suitable for the diffusion of large polycyclic aromatic hydrocarbons, and the MCM-41 zeolite with low silica to alumina ratio has higher open-loop activity [17]. To sum up, the online upgrading of rape straw with MCM-41 zeolite is more conducive to the depolymerization of macromolecule thus leading to the production of aliphatic groups and then generate hydrocarbons. Besides, the MCM-41 zeolite is conducive to the deacidification of fatty acids to generate hydrocarbon, accompanied with some ring-open reaction of aromatic compounds to form chain substances.
3.5. Durability of Catalysts
3.5.1. Effects on physiochemical properties of organic phase
For further study of durability of MCM-41 molecular sieve on the upgrading of biomass, the physiochemical properties of organic phase prepared by different time-used of MCM-41 zeolite were analyzed. The MCM-41 zeolites have been used to continuously catalyze biomass for 50, 100, 150 and 200 min and the catalyst samples have been marked as Cat-1, Cat-2, Cat-3 and Cat-4, and the organic phase prepared in corresponding time have been labeled as B1, B2, B3 and B4.
The physiochemical properties of organic phase are shown in Table 8. It is observed from Table 8 that the high heating value of organic phase showed a first increase and then a decrease trend, and the oxygen content and pH value had the opposite trend. Moreover, the kinematic viscosity of organic phase presented an increase trend after upgrading. It is assumed that the active sites of catalysts have been gradually covered with coke with prolonged use, and deoxidation of catalysts have been gradually weakened, which led to the increase of oxygen contents. Meanwhile, the acids and aldehydes in organic phase cannot be fully transformed, which led to the decrease of pH value. Moreover, the channels with catalytic activity have been blocked with deposition of coke and macromolecules cannot be sufficiently catalyzed, which resulted in the increase of viscosity. For comprehensive investigation of quality changes on the organic phase, the physiochemical characteristic parameters of organic phase have been defined in terms of C. The dimensionless and same magnitude of each set of data has been treated based on average method, which means that the average value were divided by the data points in each group, and then the C value of organic phase in each group have been calculated. The physicochemical characteristic parameter of C is calculated as Eq. (3):
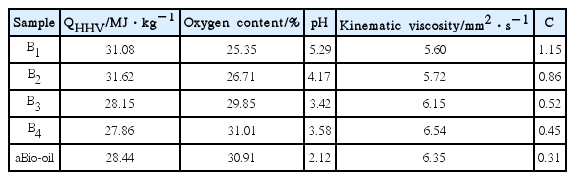
Physicochemical Properties of Organic Phase
It can be seen from Eq. (3) that the physicochemical characteristic parameter C was larger when the organic phase had higher calorific value and pH, lower oxygen content and kinematic viscosity, which means that the quality of bio-oil is better. It can be seen from Table. 8 that with the extension of MCM-41 catalytic time, the C value had gradually decreased and the quality of organic phase began to deteriorate. Among them, the C value of B1 and B2 is higher, which is 1.15 and 0.86 respectively and indicates that the comprehensive quality of bio-oil is better. With the extension of MCM-41 catalytic time, the amount of coke deposited on the MCM-41 zeolites has gradually increased and many active sites have been covered. Further, the catalytic activity has gradually decreased accompanied with the high temperature inactivation, which led to the gradual deterioration of bio oil and the C value has gradually decreased.
3.5.2. Thermo-gravimetric characterization
The thermo-gravimetric curves (TG and DTG) of the samples Cat-1, Cat-2, Cat-3 and Cat-4 with different time used are reported in Fig. 7. As it shown in Fig. 7, all samples have two weightless intervals. The first weight loss on the TG curves of the samples was happened at the range of about 200–300°C, where the products are mainly water adsorbed on the catalyst surface and some low-boiling substances, in which the Cat-1 sample had the highest weight loss (9.02%). MCM-41 zeolite dehydrated again at higher temperature during the catalytic process and the weightlessness of Cat-2 (8.26%), Cat-3 (7.57%) and Cat-4 (5.74%) are lower. The second weight loss on the TG curves of the samples was happened at the range of about 300–800°C, this phenomenon was caused by the oxidative decomposition of coke adsorbed on the catalyst, where the Cat-1 sample had the lowest weight loss (4.97%) and the Cat-4 sample had the highest weight loss (14.81%). In addition, the weight loss of MCM-41 zeolite increased significantly with the extension of the use time.

Thermo-gravimetric curves of MCM-41 catalysts.
During the catalytic upgrading process, the coke deposited on the surface of the catalyst can be present in two different forms. Fanchiang and Lin [33] defined the coke at lower temperature as oxygenated coke and that at higher temperature as graphite-like coke. Oxygenated coke had a filamentous or rodlike structure, loose, easy to remove, while graphite-like coke had a dense lamellar structure, difficult to remove [34, 35]. Previous researches on the catalytic upgrading of biomass with HZSM-5 zeolite had been conducted and found that the deactivated catalysts gave two weightless peaks in the range of 300–800°C, which is 300–600°C and 600–800°C respectively [36]. This phenomenon indicated that coke deposited on the catalysts had different structures, including the oxygenated coke and the graphite-like coke, wherein the decomposition temperature of graphite-like coke is higher and more difficult to remove. It can be seen from Fig. 7 that the Cat-4 with more serious deactivation appeared only one weight loss peak within the range of 300–800°C, which indicated that the coke deposited on the catalyst were mainly oxygenated coke and is easier to remove. MCM-41 zeolite had larger surface area and special pore structure than HZSM-5 zeolite, which allowed larger molecules to enter the interior catalytic pores and exit the channels after catalytic reorganization. Less coke was produced and the opportunities of blocking pores are fewer, thus less coke was formed and the component of coke was single.
4. Conclusions
The investigation involved the vacuum pyrolysis of biomass (rape straw) and the online catalytic upgrading of pyrolytic vapors with MCM-41 in the second-stage reactor, optimization of organic phase yield was further conducted by employing single factor experiment and RSM. The optimal conditions for the maximum organic phase yield were obtained at catalyzing temperature of 502.7°C, catalyzing bed height of 2.74 cm and system pressure of 6.83 kPa. Confirmation runs gave 15.84% of the organic phase yield compared to 16.19% of predicted value.
The use of nanocrystalline MCM-41 zeolite caused a remarkable decrease of oxygen content (17.32 wt.%), an increase of higher heat value (33.08 MJ/kg) and pH value (5.12) and a decrease of density(0.98 g/cm3) and kinematic viscosity(5.87 mm2/s). The FT-IR analysis showed that the composition of organic phase was complicated which including many substances, such as alcohols, phenols, carboxylic acids, ketones, aldehydes, esters, aromatics and other substances. The GC/MS analysis showed that the content of oxygenated aromatics had decreased and hydrocarbons had increased, and the hydrocarbons in organic phase were mainly aliphatic hydrocarbons.
The physicochemical properties of organic phase began to deteriorate and the activity of catalysts was significantly reduced after the MCM-41 zeolite continuously upgrading biomass for 100 min. The most serious deactivated Cat-4 sample had only one weight loss peak within the range of 300–800°C, which indicated that the component of coke deposited on the catalyst was single and easy to remove.
Acknowledgments
This work is currently supported by the National Natural Science Foundation of China (No.51276085), the Graduate Students Scientific Research Innovation Project of Jiangsu Ordinary University (KYLX_1039), the Foundation of Jiangsu Province Key Laboratory (QK13005) and the Priority Academic Program Development of Jiangsu Higher Education Institutions ([2011] No.6).