An investigation into the efficiency of biocides in controlling algal biofouling in seawater industrial cooling towers
Article information

Abstract
Biofouling in the open recirculating cooling water systems may cause biological corrosion, which can reduce the performance, increase the energy consumption and lower heat exchange resulting in reduced efficiency of the cooling tower (CT). Seawater CTs are prone to bio-fouled due to the presences of organic and inorganic compounds which act as nourishment for various microorganisms like (algae, fungi, and bacteria) for their growth under certain environmental conditions. The most commonly being used method to control the biofouling in CT is by addition of biocides such as chlorination. In this study, diatom and green algae were added to the CT basin and its viability was monitored in the recirculating cooling seawater loop as well as in the CT basin. Three different types of oxidizing biocides, namely chlorine, chlorine dioxide (Chlorine dioxide) and ozone, were tested by continuous addition in pilot-scale seawater CTs and it was operated continuously for 60 d. The results showed that all biocides were effective in keeping the biological growth to the minimum regardless of algal addition. Amongst the biocides, ozone could reduce 99% of total live cells of bacteria and algae, followed by Chlorine dioxide at 97%, while the conventional chlorine showed only 89% reduction in the bioactivities.
1. Introduction
Open circulating cooling water is widely used in process industry to controlling temperatures by transferring heat generated in industrial processes. A system with a fixed cooling circuit, the water intake and blowdown usually change with the varying parameters such as quality and temperature Open recirculating cooling water systems are used [1, 2]. The air steam drawn from the cold side would cool down the hot water received from the process, majority getting lower temperature and a portion of it is evaporated. The most common used and acceptable type is open recirculating system based on an economic point and water consumption [3]. On the other hand, the open circulating cooling water system suffered some operational risks such as scaling, corrosion and biofouling [4]. Biological fouling (or biofouling) in open circulating cooling water systems causes the equipment damage through bio-corrosion, which can increase water circulating costs, reduce heat transfer thus contributing to decrease in energy efficiency of cooling system, and clog the CT systems [5–11]. Geesey and Bryers [12] have been reported that 4% of the failures of power stations are caused by fouling at United State. In Europe, the heat exchanger fouling has high costs of maintenance. Common biofouling types of microorganisms found in a CT system are bacteria, fungi, algae, and larger organisms, mainly barnacles and mussels [10, 13–15]. The microorganisms present in most parts of cooling systems, which are contact with water [16]. The makeup water of the CT is exposed to contaminants including salt, organic nutrients and suspended solids which are responsible for fouling during the cooling water recirculating [16, 17]. Moreover, the water temperature in circulating cooling systems is an ideal environment for biological growth [18].
To control the biofouling in the CT, basically chemical and physical treatments are used and these treatments used to be employed either separately or together [19]. The most widely practiced approach to inhibit the biofilm formation and inactivate the microorganisms or reduce the biological activity in the cooling water process is the chemical treatment using biocides such as chlorine, chloramines, ozone and chlorine dioxide (Chlorine dioxide) classified as oxidant [20–23]. Physical treatment (e.g., membrane filtration) has been recently reported as alternative disinfection methods, but its practical effect has not yet proven [24].
Among the various oxidants, chlorine is one of a popular oxidizing biocides method for controlling biofouling growth in CTs, which is used commonly around the world [10, 25]. A primary advantage of chlorination is effective in inactivating a wide range of pathogens and microorganisms. On the other hand, chlorination is not favored due to formation of harmful by products disinfection by-products (DBPs). Chlorination have also been reported an issue in maintaining a residual concentration and appearing corrosion in CT system [24, 26, 27]. Trihalomethanes (THMs) were classified as a volatile organic group produced when chlorine reacts with the organic in the water and indicator of DBPs formed in the water [28].
Ozone is one of the greatest oxidants and high effectiveness than chlorine at low concentration in the water treatment application [29]. Several studies have shown that ozone has lower contact time CT and effective in inactivating bacteria, viruses, and protozoan cysts under certain conditions [30]. Ozone has several applications of the treatment such as oxidation of reduced metals, treatment of synthetic organic compounds and control fouling in seawater for intake pipes. Recently, Ozone has been utilized in several thousand public water treatment plants as part of chemical disinfection treatment [31, 32]. High ozonation dosage, 5 mg/L for 5 min a d in seawater, was sufficient to keep titanium, aluminum brass and epoxy coated PVC cooling tubes clean [33]. Ikegami et al. [29] reported that low ozone concentration between 0.2 to 0.5 mg/L could control fouling at an acceptable level. Ozone residual equivalent of 1.0 mg/L of total residual oxidant (TRO) was sufficient to disinfect seawater for marine culture efficiently [34]. Due to the presence of higher bromide in seawater, ozone reacts rapidly (half-life of 5.7 s) with bromide to form the hyprobromous acid (HOBr) and hypobromite (OBr-) [32, 35–37]. Bromate Formation during Ozonation is due to conversion of Bromide which is present sea waters as contamination. Since the chemicals are present in the seawater the formation of HOBr & OBr formation is inevitable and since it would consume the ozone and form the these molecule [32, 35–35 [38].
The red seawater used for the experiment contains around 71 mg/L of bromide hence the possibility of conversion to HOBr and OBr are high, the effect of HOBr and OBr- is not studied in this report.
Chlorine dioxide is one of the popular disinfectants used in seawater treatment. Chlorine dioxide is more effective than chlorine to reduce the living number of organisms at lower concentrations [39]. Chlorine dioxide has been used as a disinfectant in many industries such as potable water treatment and industrial waste treatment. The use of Chlorine dioxide as disinfectant has increased in distillation plants in the Gulf region [39–41]. Many sources have reported that THM formation is lower in Chlorine dioxide treatment due its lower reactivity with organic matter [40]. Chlorine dioxide that can maintain good disinfection while minimizing DBP formation, especially bromate [42]. The major differences between the Chlorine dioxide and other biocides are: Chlorine dioxide is more soluble than Cl2. It is effective over a wide range of pH, and Chlorine dioxide does not react with bromide [39].
In this study, alternative oxidants (ozone and Chlorine dioxide) were tested in three different pilot-scale seawater CTs. Their effects as a biocide were evaluated by determining the viable cell count quantified using a flow cytometer (FCM). Concentration of TRO was also measured to maintain the sea discharge regulation (0.2 mg/L). Algae containing diatom and green algae were added to seawater CT basin to see clearly the effect of biocides on the control the algal fouling.
2. Materials and Methods
The effectiveness of oxidizing biocides in seawater CT was studied at the pilot scale with addition of algae. CT systems were operated with continuous feeding of seawater and different oxidants (chlorination; sodium hypochlorite as a control, chlorine dioxide, and ozone).
Seawater quality parameter analysis was monitored in situ (or field measurements) together with lab analyses. All the key factors related to the CT operations and their performances were investigated. In addition, during this pilot scale study the effect of water quality and oxidation practices and their effects toward biofouling and microbial activities were monitored.
2.1. Pilot Scale Model
The pilot scale CTs were located close to the seawater intake system of seawater reverse osmosis (SWRO) desalination plant where can supply fresh seawater to the CTs. The pilot-scale facility was set in an open atmosphere, which could be exposed to all types of environmental conditions. The design of pilot scale CTs is a mechanical draughts, where is the fan located at the top of the tower. The pilot test program and the condition of the experiment are given in Table 1. The test-1 denotes the chemical biocide (chlorination) switched off to enhance the growth of algae. The test-2 chemical biocide (chlorination) switched on to evaluate its performance in presence of algae. The operation of the pilot-scaled controlled by using LabView system with remote access.

Pilot Plant Test Program
In the experimental system, the CT basin supplied by seawater (characteristics showed in Table S1.) at 2 L/min through make-up CT. The recirculating seawater was pumped at 24 L/min form the CT basin passing the heater exchanger and sprayed into to CT, while the oxidant was pumped at 21 L/min from the basin passing the chemical oxidation and back to the CT basin. The overview of the pilot scale parameter was summarized in Table 2.
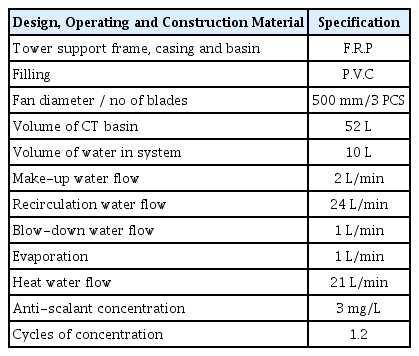
Summary of the CT Process Parameters
The pilot plant cooling towers were constructed at Central Utility Plant (CUP) where can supply fresh seawater from intake plant. The pilot-scale facility was set outside (below) such that it could be exposed to all types of environmental conditions, e.g., pollutants, including dust, mold, humidity, temperature and other types of contaminants that are commonly present or similarly experienced at a full-scale facility due to its operations.
The pilot plant cooling towers are mechanical demonstrating types and its diagram is depicted below. The automated pilot operation runs was maintained by the LabView system allowing the control of all three cooling tower systems (pump on/off, power on/off, dosing rate, water quality monitoring, etc.) with remote access. The cooling system has open loop supplies by seawater and close loop supplies by freshwater as shown in Fig. 1.
Diagram of pilot plant cooling seawater system.
2.2. CT Operation with Biocides
Three different oxidants disinfection systems were used in the experiments are: Cooling tower no. 1 (CT1, as sodium hypochlorite control): 0.2%w/w Cl2 from sodium hypochlorite (5.65–6%) stock solution. Cooling tower no. 2 (CT2, Chlorine dioxide): Is prepared by mixing two chemical from 20 L of Hydro Chloric acid @ 9%w/w (prepared by adding 4.86 L of Hydro Chloric acid 37%w/w into 15.14 L of MQ water) and 20 L of sodium chlorite @ 7.5%w/w (prepared by dissolving 2,006 g of sodium hypochlorite into 20 L of MQ water) Cooling tower no. 3 (CT3, ozone): ozone of 1.5 g/Nm3 (normal temperature and pressure were 20°C and 1 bar, respectively) was generated in-situ at 1 L/min of O2 by passing concentrated oxygen into a corona- discharged ozone-producing. The generated ozone was then injected in the form of micro-bubbles into the seawater line. The concentration of the produced ozone was regulated by the lab-view. The disinfection residuals for all CTs also remained within the targeted levels after addition (TRO = 0.2 mg/L at oxidation-reduction potential (ORP) level of + 600 mV).
2.3. Analyses
2.3.1. Field measurements
On-site parameters such as conductivity, pH and oxidation-reduction potential were measured by using 3D TRASAR technology. This was designed for measuring the key system parameters for the CT operation. In parallel, hand field test was conducted at pilot plant site to double-check the on-site data at different sampling points, which were not covered by on-site analyzers. Hand held parameters measured were pH, conductivity, dissolved oxygen (DO), ORP, turbidity and TRO.
2.3.2. Lab analyses
Dissolved organic carbon (DOC) was measured by using a Shimadzu analyzer after filtering the sample through a Whatman filter (pore size = 0.45 μm). Flow cytometer (FCM) was used to quantify the live/dead cells in all samples points of all pilot-CTs. The mixed stain of SYBR Green I (SGI) and Propidium Iodide (PI) was used. An ultraviolet (UV) light source at 254 nm (UV254) and the amount of light absorbed provides an ongoing indication of natural organic matter (NOM) in the seawater samples. More specifically, UV254 is the best detector of aromatic or reactive organics, which can form disinfection by-products (DBPs) when combined with chlorine. Inductively coupled plasma optical emission spectroscopy (ICP-OES) used for the detection of trace metals. Ion chromatography (IC) (Dionex IC 3000 model) allowed the separation of ions and polar molecules based on their affinity to the ion exchanger. A small volume of sample (typically 2 to 3 mL) was introduced into the IC analyses. Disinfection by-products (DBPs) can result from reaction between organic and inorganic matter in water by chemical treatment agents during the water disinfection process. The DBPs were included; namely chlorite, chlorate and bromate trihalomethanes (THMs) and were analyzed using gas chromatography-mass spectrometer (GC-MS) with purge and trap (EPA 524.2) [43].
3. Results and Discussion
After operating the pilot scale seawater CTs for 60 d at two conditions: without oxidation and for first 30d, and with oxidation for 30 d with algae addition and continuous antiscalant dosing for both conditions. The results show that, all CTs were able to control the growth of algae successfully in the actual full-scale plant condition. It could also maintain the targeted COC = 1.2 and delta T = 10 ± 2°C of the inlet and outlet temperature at the heat exchanger. For this study the oxidation treatment of all CTs were firstly suspended for 30 d to promote algae growth after inserting to the CT basin, then introduced the oxidants. This was to assess the efficiency of oxidants biocides in controlling bio-growth including algae after such postponement.
3.1. Cooling Tower Performance with or without Oxidation
This study was divided into Test 1 (no-oxidation), and with algal addition as part of pilot test program, followed by Test 2 (with oxidation). The intention for the first scenario to promote higher level of algal growth by inoculating with actual algae for all three CTs, in assessing robustness in tackling the higher level of biological growth in CT operations. Addition and inoculation of the algae resulted at elevated algal growth in the pilot-CT as shown in Fig. S1(a). At the initial experiment of adding algae to the basin most of the big particles of algae were suspended on the sand filter as shown in Fig. S1(b). Sand filters have been used for biofouling control in cooling tower processes and with good effect. 70–80% reduction of oxidizing biocides usage can be achieved by using biofilter, which reduce the nutrient levels and microbial growth in cooling towers system.
During the first 30 d of the pilot scale CT operations, a higher level of algal growth was observed as can be seen from Fig. 2 measured by FCM). The results suggest that all of the three oxidants were effective in keeping the active cell counts to minimal for all CTs even after algae addition. Among them, with remained dosing of ozone and Chlorine dioxide tended to be more effective in keeping the microbial count to lower value compared to the chlorine keeping the same TRO value.
Flow cytometry (total cell numbers) of all CTs.
3.2. Effect of Oxidation with Algae Addition
After a postponement of the oxidation practices for 30 d (Test 1) and with algal inoculation to promote higher level of biological growth, the oxidation practice was then reinstated for additional 30 d. During the first week of the pilot operation after 30 d of suspension resulted in increased biological growth in all CTs. It was also noted with introduction of the oxidation the total microbial count (as FCM) went down significantly (by more than 90%) (Fig. 2). This shows the robustness of the overall oxidation process, in controlling the biological and algal growth and biofouling. Thus, the remaining weeks continued the oxidation practices, to assess robustness of the overall oxidation process in minimizing the algal growth. The result of ORP, TRO, pH, conductivity and DO measurement for all three CTs showed that there was no change in disinfectant and chemical addition did not affect the seawater chemistry.
3.2.1. Oxidation-reduction potential
During the 30d of this pilot scale operation (Test 2) with continued oxidation practices, the pilot CTs were able to maintain all of the targeted operational condition, with +600 mV; equivalent to TRO of 0.2 mg/L during the operation. The average value of ORP measured during the oxidation suspended was around +300 mV. The ORP value increased up to +600 mV when the oxidation turned on. The targeted ORP level at discharge was reached by adjusting the chemical dosing, which is controlled by using Lab-view (set point = +600 mV). The ORP values for all three CTs during the oxidation were mostly around +600 mV, while the CT2 (using Chlorine dioxide) was more fluctuated as indicated in Fig. 2.
3.2.2. Total residual oxidant
The TRO values measured at field for all three CT’s were below 0.07 mg/L Cl2 in the first 30 d, this is due to the absence of oxidants. After the period promoting higher level of biological growth, the oxidation practice was reinstated and TRO increased to 0.20 mg/L Cl2 at discharge. This reading was agreed with the regulation requirement 0.20 mg/L Cl2 due to operating CT with oxidant.
The overview average values of the TRO and ORP during the experiment are given in Table 3.
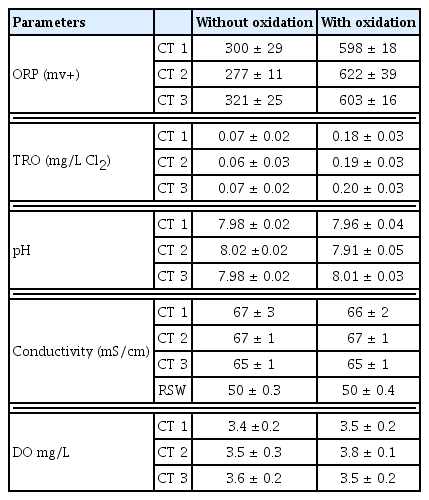
Average Values of ORP TRO, pH, Conductivity, and DO

Concentration of DBP’s for All CTs
3.2.3. pH, conductivity and dissolved oxygen
During tests 1 and 2 all the in situ data of all three CTs behaved consistently. In-situ pH measurements for all CTs showed results around 8.0. It was expected that there was no major pH change over 60 d and slightly fluctuation pH results of CT2 (using Chlorine dioxide) with the oxidation were applied at this period.
The plots of all three CTs show a similar conductivity average value of around 65 mS/cm at basin. The conductivity values were also measured at field within the three CT lines. The conductivity measurements on the makeup line is around 54 mS/cm, while the CT basin shows the conductivity close to 65 mS/cm, thus approximating the targeted COC of 1.2 for all three CTs. Table 3 shows overview of the pH and conductivity average value. Dissolved oxygen was measured for all CTs and observed that, during the organic addition the results increase 70 % as indicated in the same table, the average value of DO concentration around 3.6 mg/L at all the cases.
3.3. Disinfection By-products
In terms of the DBPs formation, particularly for this period, a significantly lower level of TTHMs was noted for all three trains. The DBPs including TTHMs (chlorinated byproducts), chlorate/ chlorite (Chlorine dioxide byproducts), and bromate (ozone byproducts) were also measured during this operation. The results for TTHMs, chlorite/chlorate and bromate analyses show the chlorite and chlorate level due to Chlorine dioxide were less than 11 ng/L level. For chlorine, the TTHMs were about 67 ng/L. Ozone generated the TTHMs more than 70 ng/L and about 30 ng/L of bromate as shown in Tabel 4. All of the results suggest that DBPs level (chlorite and chlorate) using the Chlorine dioxide was at acceptable level (< 11 ng/L of chlorate), but associated DBPs in other two trains were above that level. The maximum allowable contaminant total THMs level at 80 and 60 ng/L for HAA( total of mono, di and triHAA) according to US EPA (2001a) [44].
The flow cytometer (FC) results presented in Fig. 2, suggesting that all of the three oxidants were effective in keeping the active cell counts for all three pilot CTs, even under increase algal growth. Among them ozone tends to be effective in keeping the microbial count to lower value than to the chlorine, while Chlorine dioxide higher effective than chlorine. However, in terms of the DBPs formation, particularly for this period, a significantly lower level of TTHMs was noted for Chlorine dioxide (< 10 ng/L for TTHMs).
3.4. Organics
The algae addition to the CT basin results in a slightly higher level of DOC than raw seawater. Moreover, after 20 d a sudden increase of DOC (right after the algae addition) was observed for all three CTs as shown in Fig. 2. This is due to that, Algae green and diatom grown in surface water media produced dissolved organic carbon and turbidity [45].
The UV specific absorbance at 254 nm (UV254) has been often used as an indicator of the DBPs concentration of the water oxidants treatment [46, 47]. The highest UV254 absorbance at high DBPs formation were obtained for CT3 (with ozone) around 0.06 cm−1, CT1 (chlorination) around 0.04 cm−1, and the lowest for CT2 (Chlorine dioxide) due to less DBPs formation around 0.02 cm−1.
3.5. Inorganics
ICP and IC, which are an extremely sensitive detection technique, used to measure the concentration of selected trace constituents of the seawater CTs and their data at both conditions (with oxidation and oxidation) are given in Table S2 (supplementary information). The efficiency of disinfection and byproduct formation affect the water quality parameters, particularly for surface water where seasonal variation in dissolved organic carbon, temperature, and turbidity [48]. Normally, the chemical oxidation will enhance to the removal of natural organic matter, and suspended solids, with no change in mineral compounds, with slight change in the water chemistry [49, 50]. For instance, the use of ozone in cooling seawater treatment showed reduction in nitrate and bromide, this is due to the potential to form bromate compare to cooling towers without oxidation. Other chemical oxidations have similar effect to the water quality as shown in Table S2.
4. Conclusions
The main aim of the study is evaluate the performance of all three oxidants Chlorine, Chlorine and Ozone with the reduced algae in the system. During the process operation of cooling tower the COC was fixed at1.2 at ambient temperature conditions, TRO at discharge was maintained at 0.2 mg/L keeping in view of EPA regulation and minimal change in water chemistry. This research work was designed to have easy translation to industries which require or have industrial sea water cooling tower treatments which resembles to simulated system.
Followings are some of the key findings from the pilot-scale assessment.
The CT was found to be an effective in replicating the full-scale ones in term of COC and differential (Delta-T) temperature at the heat exchanger with residual chlorine as TRO level.
Ozone and Chlorine dioxide oxidants were an effective in keeping the microbial growth to the minimum than chlorine (even after the algae).
The amount of DBPs formed was low when used Chlorine dioxide of seawater CT treatment.
Among the oxidants, ozone was found to be effective in minimizing bioactivities for similar TRO level as compared to chlorine and Chlorine dioxide, however other parameters, in terms of cost benefit analysis, corresponding capital and operation and maintenance costs, efficacy and efficiency along with ease of operations, treated water quality, environmental impacts, etc., are needed to be carefully considered and evaluated, to suggest one oxidant type over another.
In situ data analysis of oxidation-reduction potential for CT1, CT2 and CT3.
Dissolved organic carbon for all CTs.
Supplementary Information
Acknowledgements
The research reported in this publication was sponsored by SABIC under the Grant Agreement number 1096 and by the King Abdullah University of Science and Technology (KAUST).
Notes
Author Contributions
S.J. (Ph.D) helped in designing the pilot plant of Sea water cooling tower and programming them to have a safe working condition. J.S. (Ph.D) helped in analysis of the biological components (Total life cell). R.A. (Ph. D) contributed to setting up the pilot plant according to environmental regulation requirement according to industrial regulations. R.A.S. (MSc) helped in data analysis, seawater quality test and reviewed final manuscript. NG. K.C. (Professor), A.G.L. (Professor) and L.T.O. (Professor) were instrumental in guiding the research work and suggesting the experimental designs and implantation. All results are reviewed by discussed with them.