Life cycle assessment of diesel blending production
Article information
Abstract
The global transportation sector is one of the significant fuel consumers and contributes directly to greenhouse gas emissions due to fossil fuel consumption. Diesel blending used to reduce the reliant of fossil diesel in the transportation sector. Thus to reduce the environmental burden of fuel usage, new diesel blending formulations consist of biofuels were developed. The objective of the study is to assess the environmental performance of the five new diesel blending formulations with the existing diesel blending formulation by using Life Cycle Assessment method. In midpoint categories, the conventional B5 diesel blending has shown the lowest environmental impact compared to other fuels in most categories except for marine eutrophication, natural land transformation, ozone depletion, and terrestrial ecotoxicity. In the weighting stage, B5 diesel blending scored the lowest value and followed by blending 5, thus indicating its potential as an alternative to the existing diesel blending formulation. The presence of butanol in the new diesel blending majorly affects the environmental impact for many impact categories.
1. Introduction
Globally, the transportation sector has become one of the major sectors for each country. The increasing number of automobiles each year directly consumes much energy and indirectly creates a negative impact on the environment. According to the Malaysia Energy Commission Report 2017, the total energy from the transportation sector has increased from 7834 ktoe in 1995 to 23416 ktoe in 2015. Moreover, nearly 24 million tons of CO2 were released in 1995 and increased to 50 million tons in 2008 [1]. A standard used to monitor the emission of gaseous and particulate matter from the diesel engine. Initially, Euro 1 standard has been introduced in 1992 and followed by Euro 2 to Euro 5 [2]. Different types of standards on gaseous emitted in the tailpipe, which is carbon monoxide, nitrogen oxide, and particulate matter. In general, stricken emission is applied from Euro 1 to Euro 6. In Malaysia, alphabet‘s’ is added for Malaysia’s standard, an example, Euro 2M, and Euro 4M. The similar spec between Euro 4M and Euro 4 spec is both applying sulphur content of below 50 ppm. While the differences are within other emissions such as for benzene, in Euro 4M the spec is 3.5% by volume while for Euro 4 benzene content is 1% by volume. In Malaysia, the main obstacle to improve the retail diesel standard is mainly due to the issue of the upgrading of the country’s refinery [3]. The fuel company in Malaysia have shown their commitment to upgrading diesel standard from Euro 2M to Euro5. However, the concern arises on fossil fuel supply due to fuel price movement and source depletion risk.
Renewable fuel such as biodiesel and bioethanol has become an attractive fuel to reduce the dependency on the current fossil fuel due to their environmental impact potential. There are also advanced biofuels that including non-crop and waste-based biofuels which can reduce greenhouse gas (GHG) emissions savings and do not compete with food markets. Moreover, European institutions have acceded on specific targets for the new Renewable Energy Directive (2018/2001), which including 14% of renewable energy in rail and road transport by 2030 [4]. Diesel blending an example introduced to reduce the reliance on fossil diesel in the transportation sector. The most common blending utilized today is B100, blend B20-B30, additive B5, and lubricity-additive B2 [5]. In Malaysia, the implementation of B5, which constitutes 5% biodiesel and 95% petroleum diesel in Malaysia, was started in February 2009. Although the B5 program can help to reduce emissions into the environment, for industrial purposes, the policy should target a higher blend of biodiesel in the future to ensure the success of the policy [6].
In this study, several blending formulations consist of diesel, biodiesel, bioethanol, butanol, and butyl levulinate developed by Mohidin [7], which have matched their target properties. However, the sustainability of these blending formulations questioned due to the increasing of other environmental impacts related to agricultural effects coming from biofuel components. There are concerns about the increasing impact of eutrophication due to the high utilization of nitrogen and phosphorus fertilizer in biodiesel production [8]. Therefore, the environmental impacts of new diesel blending discussed in this study. Life cycle assessment (LCA), which is one of the environmental assessment tools, appears to be a valuable tool due to the comprehensive assessment of the product life cycle [9]. The study presents the environmental performance of new diesel blending formulation and later identified the best formulation in terms of environmental impact based on LCA methodology. In this study, we highlight the potential environmental impact for each diesel blending components, thus provide an overview of possible fuel blending components selections for future fuel blendings formulations.
2. Life Cycle Assessment of Fuel Blending
Life cycle assessment used to compare the potential of the environmental impact of biological catalysis and inorganic catalysis for biodiesel production. Biological catalysis is still not applied on an industrial scale. Still, the remarkable result from the lab-scale suggests significant advantages due to a simplified flow sheet for refinement and connected energy savings. On the other hand, the inorganic catalyst used in the industry. Five different options have been included in the LCA study to evaluate the alkali and enzyme-catalyzed production route from rapeseed oil as biodiesel raw material. Methanol or ethanol used as a chemical for the transesterification reaction. The LCA results showed that the enzymatic production rate or biological catalyst is more environmentally favourable in all impact categories [10]. Another work by Nanaki and Koroneos [11] identified the environmental impacts of diesel, gasoline, and biodiesel application in Greece. Eight potential environmental impacts were included in this study: fossil fuel depletion, eutrophication, acidification, organic respiratory effects, greenhouse effect, inorganic respiratory effects, carcinogenic effects, and ecotoxicity. The results showed that biodiesel appeared greener since it significantly reduced GHG emissions compared to others. Despite the advantage, the utilization of biodiesel increased the emissions of particulate matter (PM10), nitrogen oxides (NOx), nitrous oxide as well as eutrophication. The LCA study help in assessing the available options for a better sustainable transportation system plan in Greece.
Study on biodiesel from soybean, jatropha, and microalgae for China conditions highlight the advantages of biodiesel based on several potential environmental impacts generated, such as Abiotic depletion potential (ADP), Global warming potential (GWP) and Ozone depletion potential (ODP) [12]. Despite the advantages of biofuel, it showed risk to other potential environmental impacts. Based on Photochemical oxidation creation potential (POCP), a significant increase of soybean, a slight increase of jatropha, and a slight reduction of microalgae could result in an increase of 143.43%, 101.83%, and 92.66% in POCP compared to fossil fuel, respectively. A higher level of POCP was directly caused by Volatile Organic Carbón (VOC)-(hexane) emission during the vegetable oil extraction [13]. Beer and Grant [14] applied LCA for the assessment of emissions from fuel ethanol and blends in Australia for heavy and light vehicles. Based on the technology extant in 2003, 85% or more ethanol composition shows benefit in greenhouse gas reduction both in light and heavy vehicles in strive to meet Euro3 and Euro4 standards for hydrocarbon emissions.
Jong et al. [15] considered the application of renewable jet fuel for the aviation industry. Based on the well-to-wake boundary, Fischer–Tropsch pathways yield the highest GHG emission reduction compared to fossil jet fuel (86–104%) of the pathways in scope, followed by Hydrothermal Liquefaction (77–80%) and sugarcane- (71–75%) and corn stover-based Alcohol-to-Jet (60–75%). The study highlights the importance of fuel feedstock and conversion technology used as plantation stages which is one of the dominant issues for biofuel usage. Grant et al. [16] evaluated GHG emissions from the production of ethanol and biodiesel at Western Australia. Greenhouse emission advantage in biofuel usage is mainly from absorbed carbon during the cropping cycle. An example, electricity production in Western Australia generated from coal, thus substituting the source of energy such as electricity from bio-refining, can significantly reduce GHG emissions. The limitation of production of biofuels is environmental costs from land use. The finding also found that the production of biodiesel cause higher environmental impact potential risk than diesel production but beneficial in tail-pipe emission. Bai et al. [17] compared the environmental performances of E85 and E10 blending at vehicle operations by using switchgrass as ethanol feedstock. Ethanol fuel blends show less GHG emissions but do not offer environmental benefits in the other impact categories compared to gasoline. Switchgrass plantation highly contributes to eutrophication, acidification, and toxicity impacts besides tailpipe emissions from bioethanol cause a more significant impact in photochemical smog formation.
3. Materials and Methods
New blending formulations were developed with intentions to have a minimum potential environmental impact. The main aim of the research is to assess and quantify the environmental performance of the new diesel blending formulation consisting of five types of fuels, namely diesel, biodiesel, bioethanol, butanol and butyl levulinate using LCA methodology. The methodology of life cycle assessment, according to the ISO 14000 series, was used in this research. Fig. S1 (Supplementary Material) illustrates the overall research framework. Each phase is necessary, followed step by step, to meet the standards.
3.1. Goal and Scope Definition
The blending formulation consists of biodiesel, diesel, bioethanol, butanol, and butyl levulinate. Data inventory, for input and output of each blending composition, collected through literature and software database. The data is assumed based on current technology and also represents Malaysia’s condition. The boundaries have been set up based on cradle-to-gate for each diesel blending composition. The collected inventory data was modeled using LCA software (Gabi 7). The life cycle impact assessment (LCIA) results of five different blending formulations and comparison with pure fossil diesel were later applied. The environmental impacts of diesel blending formulation were investigated until the weighting phase. The functional unit for the study was based on 1MJ of diesel blending. The overall LCA framework for the study is illustrated in Fig. S2 (Supplementary Material), and Table 1 shows five different blending formulations applied in the study. The blending was formulated by Mohidin [7], has matched their target properties such as density, cetane number, and calorific value.

3.2. Life Cycle Inventory and Modeling
In LCA, data were collected from the literature review, software data, estimations, and assumptions. The data obtained were inserted into the LCA software. In terms of transportation, equal distance (50 km) was assumed for each diesel blending component. Sources and types of data collected for LCA are summarized in Table S1. (Supplementary Material) LCA modelling illustrated in Fig. S3 (Supplementary Material).
3.3. Life Cycle Impact Assessment
Nineteen potential impacts included in ReCiPe v1.08 (H) LCIA methodology was used to quantify the potential environmental degradation of different diesel blending formulation. In the normalization stage, the study applied ReCiPe v1.08 (H), Mid-point Normalization, World, including and excluding biogenic carbon (person equivalents). While in the weighting stage, the study applied Thinkstep LCIA Survey 2012, Global, ReCiPe v1.08 (H), including and excluding biogenic carbon (person equiv. weighted). A comparison study for each diesel blending components was included based on 1MJ of Energy excluding of butyl levulinate.
4. Results and Discussions
4.1. Mid Point Result-Green Diesel Formulation
The environmental performance of new diesel blending formulations are presented in 18 impact categories, which summarized in Table 2, and the percentage contributor for each impact is illustrated for each impact (see Fig. 1 to Fig. 3). Referring to Table 2; the red colour number indicates the hot spot within the categories. Generally, the current B5 blending has shown better environmental impact for most impact expect for marine eutrophication, natural land transformation, ozone depletion, and terrestrial ecotoxicity.

Summary Result for New Diesel Blending Formulation and B5

Potential environmental impact for new diesel blending formulation for (1) Agricultural Land Occupation (2) Climate Change (3) Fossil Depletion (4) Freshwater Ecotoxicity (5) Freshwater Eutrophication and (6) Human Toxicity.

Potential environmental impact for new diesel blending formulation for (1) Particulate Matter Formation (2) Photochemical Oxidant Formation (3) Terrestrial Acidification (4) Terrestrial Ecotoxicity (5) Urban Land Occupation and (6) Water Depletion.
4.1.1. Impact of land use
The land use impact determines the damage to ecosystems due to the effects of occupation and transformation of land [18]. The mechanism of land use impacts considered land transformation activity affects ecosystem quality, while land occupation activity delays recovery [19]. As an example, the conversion of tropical forests into plantation areas causes the reduction of tropical forests. It should be noted that that land use impacts also involve aquatic surfaces; thus, some activities imply the occupation or transformation of the water surface. The limitation of production of biofuels is environmental costs from land use. In term of land use impact assessment, three impacts include in ReCiPe v1.08 methodology are 1) Agricultural land occupation, 2) Urban land transformation, and 3) Natural land transformation.
Agricultural land occupation refers to the amount of agricultural area occupied (in m2) and the time of occupation in years. Particularly, agrarian activities lead to a significant loss in biodiversity and, thus, impact ecosystems on a worldwide scale. As indicated in Table 2, Blending 3 scored the highest value in agricultural land occupation impact while the lowest is existing B5 blending. Based on Fig. 1, Blending 3, 4, and 5 scored a significant effect on agricultural land occupation due to a high percentage of ethanol composition in the new diesel blending. Table 3 shows the comparison of diesel, ethanol, butanol, and palm biodiesel based on 1MJ of each fuel for agricultural land occupation impact. The two highest components that high agricultural land occupation impacts are ethanol and palm biodiesel. Detail assessment on ethanol production found raw material section, which is sugar beet plantation is the main contributor to the agricultural land occupation —the result aligned with palm biodiesel, where palm plantation is the primary impact source. Three main elements that contributed to the impacts are activities characterizations factor, occupational in the agricultural stage, and feed to bioethanol conversion yield. In ReCiPe v1.08 agricultural land occupation midpoint impact, characterization factor (CF) for different agrarian land-use types or diverse forest is the same except for unspecified occupation flow. The CF limits the agricultural land occupation impact methodology as not all types of occupation are the same impact on biodiversity. For example, in the crops field, the farmer will try to reduce the number of species based on their favourable plantation, as compared to production at forests [20], thus highlighting the importance of defining specific scored to each occupational activities.
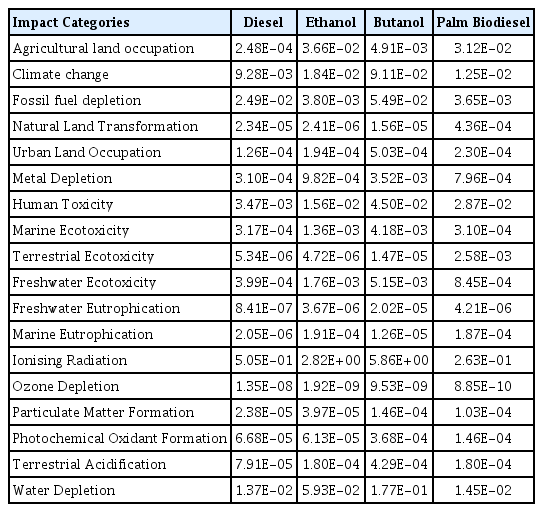
Comparison Value of 1MJ of Fuel
In terms of methodology, agricultural land occupation includes agrarian activities such as plantation in terms of area (m2a). A comparative analysis on 1 kg of eight bioethanol production from sugar cane, grass, maize, potato, rye, sugar beet, sweet sorghum, and wood; potatoes using Ecoinvent v1.2 [20] shown that from potatoes scored the highest impact which four times production of bioethanol from sugar beet. Report by FAO [21]; Greenfacts [22]; Rajagopal et al. [23] and Naylor et al. [24] (Table S2 (Supplementary Material)) show that crop yield for sugar beets is 46 tonnes/ha, which almost the same with potatoes with average 43 tonnes/ha [25]. Thus yield is not the main factor for the occupational agricultural impact. Table S2 (Supplementary Material) highlight that biofuel yield is the most significant factor which shown different biofuel have different biofuel yield such as sugar beet is the highest yield with 5060 litres/ha. At the same time, sorghum is the lowest yield with 494 litres/ha with biodiesel where oil palm is four times biofuel yields as compared with soybean (Table S2 (Supplementary Material)).
In urban land occupation, the impact refers to the amount of urban area occupied (in m2) and the time of occupation in years. In the endpoint impact, the urban land occupational impact linked to ecosystem change (species. yr). Fig. 3 illustrates that diesel compositions are the highest contributor in terms of urban land occupation for each diesel blending formulations. The other main contributor is butanol consumption. Blending 1 scored the highest impact on urban land occupation impact, and blending 5 scored the least impact. A comparison study based on 1 MJ of fuel shown that butanol scored the highest result; thus, the presence of butanol in the blending composition will increase the urban land occupation impact. Detail study on butanol production shows that carbon monoxide production and healing process is the main contributor to urban land occupation impact. In terms of life cycle inventory, the impact includes occupation in an industrial area, traffic area, and urban land area. In ReCiPe v1.08, the impacts provide the same magnitude for all relevant flows.
For the natural land transformation impact category, the land transformed from one state to the other. Two types of parameter defined as natural land and non-natural land. Non-natural land are defined as a high human intervention area such as arable fields, while natural land defined as forest, tropical forest, and sea, or ocean. The study on diesel blending formulations shows that blending 4 scored the highest in terms of natural land transformation impact, and the lowest is blending 2. Comparison study (Table 3) based on 1 MJ of fuel highlighted that ethanol, and palm biodiesel contributes 3.66E-02 m2 and 3.12E-02 m2, respectively. It is expected due to agricultural activities to produce these fuels.
Interestingly, Fig. 2 shows that the two main contributors for each diesel blending are diesel and palm biodiesel, indicating that the high percentage of components directly increase the environmental risk even though the component impact is relatively low. Detail study on diesel production identifies that the land transformation contributed from background impact through a heating process, electricity, and heavy fuel oil consumption. Reflects Table S2 (Supplementary Material), natural land transformation impact will also highly depend on biofuel yield where higher yield reduces the land usage. Moreover, Raza et al. [26] highlight that climate change or higher temperature reduces crop yield substantially if planters fail to respond to changing climate.

Potential environmental impact for new diesel blending formulation for (1) Ionizing Radiation (2) Marine Ecotoxicity (3) Marine Eutrophication (4) Metal Depletion (5) Natural Land Transformation and (6) Ozone Depletion.
4.1.2. Climate change
Climate change internally correlated with biofuel considering environmental risk and harvesting yield effects on the plantation-based biofuel production. The environmental risks include variations in annual rainfall, average temperature and heatwaves. In terms of analysis, blending 1 scored the highest climate change impact, and the lowest in the current B5 blending (Fig. 1). Two leading contributors to climate change impact are butanol and diesel compositions. Assessment on each of diesel blending components (Table 3) highlights that based on 1MJ, butanol production from hydroformylation of propylene scored 9.11E-02 kg CO2 eq as compared with palm biodiesel, ethanol, and diesel 1.25E-02 kg CO2 eq, 1.84E-02 kg CO2 eq and 9.28E-03 kg CO2 eq, respectively. Diesel scored the lowest impact as compared with other diesel blending fuels, thus indicate that the high diesel contributions are due to high diesel compositions in the new diesel blendings. In butanol production, almost 30% of the impact contributed by carbon monoxide production and propylene production. Heating activities cover 20% of climate change impact from butanol production. Thus butanol feedstock and conversion technologies are crucial to reduce climate change impact from butanol production such as utilizing biobutanol as an alternative fuel. Production of butanol via fermentation has started in the early 1900 and gradually replace by petroleum route due to low petrochemicals price. However, due to price fluctuation and pollution issues, fermentation methods have received attention again [27]. However, one needs to consider the adverse effect of biofuel production.
Based on LCA perspective, biomass-based biofuels have shown a reduction of carbon emission impacts from carbon absorption through photosynthesis. Comparing climate change impact, including biogenic carbon (Table 2), biofuel components such as ethanol and biodiesel has shown advantages from carbon reductions through photosynthesis and shown in blending 3, 4 and 5, where the climate change impact has reduced 17%, 19% and 21%, respectively. Blending 5 has scored the lowest value as compared to existing B5 blending, thus shown the potential as an alternative for current B5 diesel blending. Comparison based 1 MJ on different biodiesel feedstock shown that rapeseed oil and soybean caused five times climate change impact as compared with palm oil when excluding biogenic carbon. However, when biogenic carbon considered, rapeseed oil has shown significant benefits as compared to other biodiesel feedstock.
Even though the current diesel B5 blending scored higher in terms of climate change impact, a study by Kashinath et al. [28] which design a green diesel from biofuels found that the tailpipe for CO2 emission for blending with lower diesel compositions produced lower CO2 emission as compared with other blendings. Furthermore, the study has shown that the addition of biofuel from biomass reduced the sulfur content 17.68% less compared to fossil diesel. The disadvantage, however, has shown in the economic view, which the new blending formulations have cost three to nine times of conventional diesel production cost-mainly due to higher production costs for biofuel market value, especially butyl levulinate. An LCA study by Rodríguez [29] assessed the environmental performance of two diesel blendings, which are E-10 (diesel 90%, ethanol 10%) and E-15 (diesel 85%, ethanol 15%) that considered cradle-to-grave boundary has found that the utilizations of E-10 and E-15 formulations emitted 10% lower of CO2 emission than fossil diesel. The study also reported that the amount of nitrous oxide emission is almost similar for diesel and diesel blending. Since the characterization factor of nitrous oxide in climate change impact is higher than CO2 (NOx: 298 and CO2:1). Therefore it is expected nitrous oxide is one of the primary emission in the combustion of these blending, indicates that the application of diesel blending does not necessarily improve the climate change impact of the current fossil diesel. The presence of butyl levulinate can significantly reduce soot emissions, depending on the load point [30]. Furthermore, low emissions of particulate matter are observed, showing the prospect of the fuel as an alternative for fuel or fuel components in fuel blending. However, the disadvantage is a high percentage of butyl levulinate in diesel compounds can cause a malfunction in the standard engine equipment such as the fuel hoses and fuel sealings.
4.1.3. Resource depletion
Fossil depletion impacts cover a group of resources that contain hydrocarbons, while metal depletion impacts the mechanisms considered mineral extraction from a deposit. The impacts mechanism considered production costs and the production energy requirement due to fossil fuel extraction. In fossil depletion impact (Table 2), blending 5 scored the lowest impact while blending 1 scored the highest impact as compared to other blending formulations. While in metal depletion impact, Blending 1 scored the highest value, while B5 blending scored the lowest value in terms of metal depletion impact (Table 2). In Fig. 1, for fossil depletion impact, the main contributor for each impact is present of diesel in blending composition. However, based on a comparative study on diesel blending composition (Table 3) and 1MJ, butanol scored the highest value with 5.49E-02 kg oil eq and palm biodiesel scored the lowest value with 3.65E-03 kg oil eq. In butanol production, 49% of fossil consumption comes from propylene production, while 29% from carbón monoxide production. A high percentage of diesel in diesel blending composition, however, significantly contributes to the fossil depletion impact. The result is also illustrating in metal depletion impact. However, a detailed study on butanol production identifies the background impact from plant facility and carbon monoxide production. In ReCiPe v1.08 methodology, different characterization factors assigned for each fuel. An example, in fossil depletion impact crude oil and natural gas, has the highest value with range 0.935–1.06 and 0.891–1.16 respectively. While coal, hard coal, and lignite have lower characterization factors with range 0.22–0.437, 0.419–0.729, and 0.16–0.339, respectively. It should note that the method also adopts different conversion factors for different countries such as for natural gas; Malaysia has value 0.934 while Japan is 1.06. Thus the selection of countries’ resources is crucial in reducing fossil depletion impact potential. In metal depletion impact, refer to ReCiPe v1.08 methodology, different characterization factor was assigned based on the metal composition. As such, pure copper has a higher CF value compared to the mixture of copper (a mixture of gold and silver) with each has 42.7 and 0.457, respectively. The different in CF indicates that the flow selectivity in identifying the type and purity of mineral is vital to identify the magnitude of metal depletion impact.
4.1.4. Toxicity
Toxicity impact accounts for the environmental persistence (fate) and accumulation in the human food chain (exposure), and toxicity (effect) of a chemical [16]. Toxicity impact separated into four categories which are 1) Human toxicity 2) Marine ecotoxicity 3) Terrestrial ecotoxicity and 4) Freshwater ecotoxicity. Different toxicity impact category is differentia compartment-specific fate factors for freshwater, sea, ocean, and soil compartments.
Human toxicity impact is a quantitative toxic equivalency potential to reflects the potential harm of the number of chemicals released into the environment by including both inherent toxicity and generic source to dose relationship [31]. Blending 1 scored the highest, and B5 blending scored the lowest for human toxicity, marine ecotoxicity, and freshwater ecotoxicity impact (Table 2). However, this is different for terrestrial ecotoxicity impact where B5 blending scored the highest, and blending 1 scored the lowest. Based on 1 MJ functional unit for each blending component (Table 3), butanol is found to score the highest value in terms of human toxicity, marine ecotoxicity, and freshwater ecotoxicity impact. The result is different for terrestrial ecotoxicity impact where palm biodiesel found to score the highest value. In palm biodiesel production, almost 100% of impact coming from palm oil plantation. Based on three different biodiesel feedstock, soybean caused the lowest impact and followed by palm oil and rapeseed with each 0.00033 kg 1,4-dichlorobenzene (DB) eq, 0.0026 kg 1,4-dichlorobenzene (DB) eq and 0.0033 kg 1,4-dichlorobenzene (DB) eq respectively. Thus it is advantageous if the feedstock is coming from waste that can avoid the background impact from the plantation stage.
Evaluation on butanol production shown that carbon monoxide usage significantly affects these impact with 60%, 85% and 24%, respectively for human toxicity, marine ecotoxicity and freshwater ecotoxicity impact. For freshwater ecotoxicity impact, in butanol production, 64% of freshwater ecotoxicity impact is coming from the heating process. Based on ReCiPe v1.08 methodology, few chemical flows has very significant characteristic flow such as mercury, methyl mercury and arsenic with each CF is 290000, 104774 and 62000 respectively. The presence of arsenic and mercury in butanol production directly increase the human ecotoxicity impact risk. As for marine ecotoxicity impact, mercury release to seawater is the highest CF for marine ecotoxicity with value 950. The presence of mercury in butanol production directly increase the marine ecotoxicity impact risk. In freshwater ecotoxicity, some chemical has very significant CF such as 3-Methylcholanthrene with value 98104.87. Pesticides usages also highly contribute to freshwater ecotoxicity impact such as Esfenvalerate, alpha-Cypermethrin and Cypermethrin with each has CF value of 64000, 26000 and 11000 respectively.
4.1.5. Eutrophcation
Eutrophication in inland water or sea is mainly resulting in anthropogenic activities that cause nutrient enrichment of the aquatic environment. Growth of algae can be affected by many factors; however, the availability of macronutrients phosphorus and nitrogen is dominating [18]. The magnitude of eutrophication, however, depends on local factors like topography and the physical and chemical nature of the receiving water bodies. However, In LCA studies, the characterization factor is applied to represent environmental impact risk.
Freshwater eutrophication includes phosphorus emission to water bodies. Table 2 shows that blending 1 scored the highest, and B5 blending scored the lowest. Based on 1 MJ functional unit for each blending component (Table 3), butanol is found to score the highest value. Fig. 1 highlights that butanol is the main contributor for each impact. In butanol production, 50% of freshwater eutrophication impact contributed by carbon monoxide production and heating process. Freshwater eutrophication impact is usually related to plantation-based production.
Interestingly, when we assess the carbon monoxide production, 80% of the freshwater eutrophication impact is coming from electricity consumption. In ReCiPe v1.08, phosphorus has the highest CF in freshwater eutrophication impact. The presence of phosphorus emission in electricity production increase the freshwater eutrophication impact risk. We compared biodiesel and ethanol feedstock to gain the lowest environmental impact. For biodiesel feedstock, based on 1MJ, palm oil has the lowest impact followed by rapeseed and soybean with each 4.21E-06 kg P eq, 1.56E-05 kg P eq, and 3.95E-05 kg P eq respectively. For bioethanol feedstock, based on 1kg, bioethanol from grass has the highest impact, while the lowest is from maize with each 3.68E-04 kg P eq and 1.06E-05 kg P eq, respectively.
Marine eutrophication includes nitrogen emission to water bodies. Table 2 shows that blending 3 scored the highest, and blending 2 scored the lowest. Based on 1 MJ functional unit for each blending component (Table 3), ethanol and palm biodiesel are found to score the highest value. Fig. 2 highlights that biodiesel and ethanol are the main contributors to marine eutrophication impact. Assessment on biodiesel and ethanol found that the plantation stage contributes almost 100% of marine eutrophication impact. Based on different ethanol feedstock, bioethanol from potatoes has the highest impact, while wood has the lowest impact, with each 2.46E-02 kg N-eq and 1.45E-04 kg N-eq respectively. From the biodiesel perspective, palm oil and rapeseed oil has the same magnitude on marine eutrophication impact and higher on soybean biodiesel based. In terms of ReCiPe v1.08 methodology, ammonium and nitrogen elements play a significant impact on marine eutrophication impact. The usage of these chemicals in the plantation stage increases the marine eutrophication impact.
4.1.6. Ionising radiation
Ionizing radiation describes the damage to human health related to the routine releases of radioactive material to the environment [18]. The effect and damage analysis for each substance is considered based on the Sievert exposure level. In the diesel blending assessment, Table 2 shows that blending 1 scored the highest, and B5 blending scored the lowest. Based on 1 MJ functional unit for each blending component (Table 3), butanol is found to score the highest value. Fig. 2 highlights that butanol and diesel are the main contributors for each impact. In butanol production, carbon monoxide usage contributes to 86% of total ionizing radiation impact. Focusing on carbon monoxide production, 56% of total ionizing radiation impact is coming from heavy fuel consumption.
4.1.7. Ozone depletion
Ozone depletion impact measures the risk of ozone destroyed by the action of sunlight and chemical reactions in the stratosphere [18]. Table 2 shows that blending 1 scored the highest, and B5 blending scored the lowest. Based on 1 MJ functional unit for each blending component (Table 3), butanol is found to score the highest value. Fig. 2 highlights that butanol and diesel are the main contributors for each impact. In butanol production, 77% of ozone depletion caused by carbon monoxide usage and in carbon monoxide production, 90% from heavy oil usage.
4.1.8. Human health damage due to PM10 and ozone
Fine particulate matter with a diameter of less than 10 μm (PM10) consists of a complex mixture of organic and organics substances. These substances can cause health problems and illustrate in particulate matter formation impact categories. Another issue, ozone is not directly emitted into the atmosphere but formed as a result of photochemical reactions of NOx and Non-Methane Volatile Organic Compounds (NMVOCs) [18]. The ozone formation is a health hazard to humans and indicates in the photochemical oxidant formation impact category.
For particulate matter formation and photochemical oxidant formation impact, Table 2 shows that blending 1 scored the highest, and B5 blending scored the lowest. Based on 1 MJ functional unit for each blending component (Table 3), butanol is found to score the highest value. Modelling butanol production, 40% of particulate matter formation impact contributed by carbon monoxide usage. While for photochemical oxidant formation impact 27% of photochemical oxidant formation impact is contributed by carbon monoxide usage, while 22% contributed from hydroformylation of propylene process [20].
4.1.9. Terrestrial acidification
Atmospheric deposition of inorganic substances such as sulfates, nitrates, and phosphates cause acidity in soil [18]. All plant has defined optimum of acidity. A change in levels of acidity causes shifts in ecosystems. Table 2 shows that blending 1 scored the highest, and blending 5 scored the lowest. Based on 1 MJ functional unit for each blending component (Table 3), butanol is found to score the highest value. Fig. 3 highlights that butanol and diesel are the main contributors for each impact. In butanol production, 42% of terrestrial acidification impact is contributed by carbon monoxide usage, while 26% is contributing to the heating process.
4.1.10. Water depletion
Water scarcity issue included in ReCiPe v1.08 under water depletion impact. Water is abundant, but the availability of water for human usage is a scarce resource. Extracting water in a dry area can cause very significant damages to ecosystems and human health as well as extracting and treatment costs. Table 2 shows that blending 1 scored the highest, and B5 blending scored the lowest. Based on 1 MJ functional unit for each blending component (Table 3), butanol is found to score the highest value. Fig. 3 highlights that butanol and diesel are the main contributors for each impact. In butanol production, water depletion impact is 79% contribute by carbon monoxide usage. Water depletion impact is highly associated with plantation-based fuel. In ethanol production, a comparison of different feedstock shown that potatoes based bioethanol consume the highest water volume with 6.17 m3 water while the lowest is from maize with 0.067 m3 water. In biodiesel production, palm oil consumes less water as compared with soybean and rapeseed, with each consumes 0.015 m3, 0.074 m3, and 0.087 m3, respectively—similar CF value assigned for different water sources such as a lake, river, and underground water. Thus, the selectivity of the source does not impact the water depletion risk.
4.2. Weighting-Green Diesel
Product design decisions begin with performance, cost, and environmental considerations. It is essential to solving how one analysis the LCA results in cases where there are exchanges between product alternatives. The optional elements of weighting in the LCIA phase might be a solution to this dilemma. Briefly, the weighting is a matter of value choice that leads LCA study towards a single value in the results. The stage involved in measuring the relative severity of different impact categories. The result of weighting not meant to finalize the environmental performance of a product but more towards to give additional information for product comparison.
Fig. 4 highlights the weighting result based on the global context, excluding biogenic carbon, while Fig. 5 includes biogenic carbon. Blending 1 scored the highest value and followed by Blending 2, Blending 3, Blending 4, Blending 5, and B5 blending. Both weighting procedures show consistency in terms of highest to lowest value sequence. A higher value indicates a higher environmental impact risk to the environment. The results also highlight the current B5 blending scores better environmental impact as compared with the new diesel blending formulations.

Weighting result for different diesel blending formulations based on Global’s context. (excluding biogenic carbon)
Weighting result for different diesel blending formulations based on Global’s context. (including biogenic carbon)
In terms of percentage of contributors, ionizing radiation, marine ecotoxicity, and freshwater ecotoxicity are the major contributor with an average 49%, 22%, and 16% respectively for both weighting methods. It is exciting to note that in Thinkstep LCIA Survey 2012, Global, ReCiPe v1.08 (H) weighting method, climate change has the highest preference with value 9.3 as compared with ionizing radiation and marine ecotoxicity with value 5.7 and 6.8, respectively. Thus the importance of normalization is a highlight in the result. In the normalization stage, the magnitude of ionizing radiation is magnified based on global emissions, indicating the magnitude of ionizing impact to the environment.
4.3. Sensitivity Analysis
Sensitivity analysis was applied to indicate which parameters variations that would likely to give high impact to the new green diesel formulation. In the sensitivity analysis, some of the parameters varied with a certain percentage; in this case, 20%, while some fixed. In this model, five parameters have been varied, which are diesel, biodiesel, butane, ethanol and butyl levulinate. Biodiesel found to be the most sensitive parameter in most impact category except for marine eutrophication, natural land transformation, ozone depletion and terrestrial ecotoxicity. Ethanol has a high sensitivity to agricultural land occupation and marine eutrophication impacts, while biodiesel is sensitive within terrestrial ecotoxicity impact.
5. Conclusions and Recommendations
The global transportation sector is one of the significant fuel consumers and contributes directly to greenhouse gas emissions. Five new diesel blending formulations consist of diesel, biodiesel, butanol, ethanol and butyl levulinate were developed to reduce the environmental burden of fuel usage. Nineteen environmental impact categories included in ReCiPe v1.08 (H) package used to measure the performance of the blending formulations in midpoint stage. Generally in the midpoint stage, blending 1 scored the highest impact for most impact categories except for agricultural land occupation, natural land transformation, terrestrial ecotoxicity and marine eutrophication. Based on 1 MJ comparison for each fuel components, butanol has found significant in 16 impact categories with carbon monoxide usage for butanol production has been an essential element that contributes to the high environmental impacts. Thus the presence of butanol has been seen as the main limitation in the new diesel blending formulation in term of environmental performance. Current B5 blending has the best environmental performance for 12 impact categories, while blending 5 has shown promising potential for three impact categories. However, this study suggests there is no consensus in term of best diesel formulation within midpoint categories.
In the weighting stage, blending 1 scored the highest point value and followed by blending 2, 3, 4, 5 and B5 thus indicating the blending 1 has the lowest environmental performance. Ionising radiation and marine ecotoxicity found to be the main contributor with almost 50% and 20% respectively. Climate change plays a significant role in weighting stage while ionising radiation has a higher magnitude in the normalisation stage. Thus, both normalisation and weighting are essential in contributing to the final score value. In this study, butanol production from hydroformylation of propylene is the limitation of the new green diesel formulation; thus an alternative process such as biobutanol might reduce the environmental impact risk.
Supplementary Information
Acknowledgment
The authors would like to acknowledge the support from UTM Flagship Project with Cost Center No. QJ130000.2444.00G55 provided by Universiti Teknologi Malaysia and the Malaysian Government which provided the MyPHD scholarship to the authors.
Notes
Author Contributions
C.H (Postdoctoral) the main author for article, Z.Z.N (Lecturer) reviews the article, N.H (Lecturer) and N.S.M.S (Ph.D student) contributed equally to write the article.