Multi-linear regression model for chlorine consumption by waters
Article information

Abstract
In drinking water treatment, disinfection is a key step to ensure the safety of water quality and people’s health but little is known of the relationship between chlorine consumption and water matrix properties from varied sources (BWM). In this study, we measured the fluorescence from fractions of NOM (FFN) for the relevant BWM. This included the evaluation of three components: the chlorine-dependence factor (CDF) (DOC and NH3-N), the BWM (such as NO3−, NO2− and turbidity), and FFN (I-V fluorescence fractions). Multi-linear regression model was used to fit the data. Results showed that when using the CDF, BWM and FNN, in the prediction of chlorine consumption showed the (R2) values were 0.72, 0.71 and 0.41, respectively. While the FNN did not fit the model well it did enhance the model using CDF by 11.26%. The FNN is not effective in enhancement of the BWM response to the model. Combination of the CDF, BWM and FNN or that of the CDF and BWM were both effective in prediction of chlorine consumption.
1. Introduction
The disinfection of water by chlorination is a low-cost treatment process. In water treatment engineering systems, some harmful substances still remain in the water after treatment and these substances are often transported in urban pipe network, thus the addition of disinfectants needs to be controlled [1, 2]. Therefore, the chlorination dose and its decay are both important for control of water quality in order to ensure public safety. It is well known that the chlorination process generates different types of potentially harmful disinfection by-products (DBPs) [3, 4], which are significant issues in water supply due to the significance of risk from low levels and are challenging to reliably detect [5–8]. Their generation is often the result of the interaction between the disinfectants and organic (or inorganic materials) such as dissolved organic matter and reliable testing for their presence and/or potential to form is required. A regional study in China evaluated the presence of nitrosamine disinfection by-products in 164 water samples (including factory water, tap water and primary water supply). They were found in samples from 155 sites in 23 provinces, 44 large and medium-sized cities and towns [9]. The DBPs are not easy to measure due to its low concentration or the extreme conditions needed for extraction [10, 11]. In order to simplify the test or provide a way to rapidly evaluate the potential for DBPs formation, a model between the DBPs and factors influencing their formation will improve diagnosis and aid in refining treatment conditions. In drinking water treatment plants, the potential for the formation of DBPs is related to a number of varied factors such as dissolved organic carbon, ammonia, turbidity, temperature, and chlorine residence time [12–14]. Among these factors, the chlorine consumption is dependent on water composition influencing the formation potential for DBPs. In a piped system, additional factors such as pipe corrosion should also be included. It has been reported that the chlorine consumption is able to predict the formation of DBPs, in combination with these parameters [15, 16], which is encouraging but have only been applied to one water source, and not assessed for varied water sources. The feasibility of DBPs prediction by chlorine consumption benefits both security of water quality supply and the optimization of disinfectant dose, but because the influencing parameters are varied in different water environments, the chlorine consumption may not be the same. This is critical if robust treatment disinfection strategies are to be developed, which are protective of public health.
In addition to the many factors affecting chlorine concentration highlighted above, detailed understanding of the compositional variation of DOM has been highlighted. Specific DOM components that are expressed by three-dimensional excitation-emission matrix spectrum (EEMs) have received wide attention in analysis of natural organic matter of aquatic water environments [17–19], and correlated to the formation potential of DBPs. For example, Hua et al. [20, 21] showed the correlation of dissolved organic matter with the components derived from EEMs, and carbon disinfection by-products. Other studies also show the correlation potential of fluorescence with DBPs [22, 23]. It is not difficult to see the potential for establishing the relationship between EEMs and chlorine consumption. Since there are many methods to extract the DOM components from the EEMs data (such as fluorescence intensity, parallel factor model components and integral volume of regions) and in addition collecting the EEMs is a relatively simple process without complex pretreatment before measuring [22–25], the potential for application in engineering systems is significant. The potential of DBPs formation was determined by environmental conditions such as carbon/nitrogen based compounds such as dissolved organic carbon (DOC), ammonia nitrogen (NH3-N), NO3− and NO2− [14]. The DOC and the NH3-N as parameters are always used to calculate the demand of disinfectant dosage [13]. However, the DBPs are only part of the products from disinfection by chlorination and the demand calculation for disinfectant dose is always an estimated value. The challenge is how to use these related factors to establish a model for improved calculation of chlorine consumption.
In this study, water samples were collected from typical aquatic environments, of which quality parameters were measured before and after chlorination. EEMs data was tested and was divided into different components using fluorescence region integration (FRI). Overall, the parameters used in this study included chlorine-dependence factors (DOC and NH3-N), fluorescence-divided components (I-V) and other environmental factors (e.g., NO3−, NO2−, and turbidity). Multiple-linear regression model was used to fit the experimental data using a scientific computing software, MATLAB, and to establish a function of chlorine consumption vs. these parameters in hope of giving a suggestion on selection of prediction solutions.
2. Material and Methods
2.1. Materials and Water Samples
All reagents used in this study were of analytical grade. Sodium hypochlorite (NaOCl, Aladdin Chemical Co., Shanghai, China) and sodium bicarbonate (Tianjin Institute of Chemical Reagents, China) were purchased. DPD free chlorine kit (HACH Co., USA) were used in this study. The water samples tested in this study were collected from locations in Xiangtan, Central South China to represent typical water sources they included Yuehu lake water (pH = 7.78–8.05, temperature = 23.8°C–25.6°C, turbidity = 9.4–10.1 NTU, NO3− = 0 mg/L, NO2− = 0.01–0.04 mg/L), landfill leachate (pH = 6.69–7.01, temperature = 22.5°C–22.8°C, turbidity = 0.31–0.36 NTU, NO3− = 0–0.12 mg/L, NO2− = 0 mg/L), artificial pond water (pH = 9.44–9.64, temperature = 23.2°C–24.4°C, turbidity = 17.0–17.6 NTU, NO3− = 0 mg/L, NO2− = 0 mg/L), Xingjian river water (pH = 7.54–7.7, temperature = 23.6°C–24.1°C, turbidity = 18.2–45.4 NTU, NO3− = 1.09–1.10 mg/L, NO2− = 0.10–0.32 mg/L), and sewage effluent (pH = 7.03–7.21, temperature = 22.3°C–23.3°C, turbidity = 1.30–5.16 NTU, NO3− = 5.64–7.41 mg/L, NO2− = 0 mg/L). Mean values of DOC and NH3-N concentration were show in Fig. 1. The landfill leachate was collected from Jinan City landfill from a fourteen-year-old landfill cell, which was diluted to a concentration of DOC at around 20 mg/L for chlorination. Parameters including NH3-N, NO3-N and NO2-N were all measured using a TU-1910 UV-Vis spectrophotometer (Beijing Puxi General Instrument Co., Ltd., Beijing, China), which were measured according to Chinese Standards HJ 535-2009, HJ/T 346-2007 and GB 7493-87, respectively. Turbidity and DOC were measured using a 2100Q Portable Turbidimeter (HACH, USA) and the vario MICRO Cube (Elementar Analysensysteme GmbH, Germany), respectively. Temperature and pH of water samples were also measured.

Mean values of DOC and NH3-N of raw water, and chlorine consumption in the dark for three-day chlorination.
2.2. Fluorescence Analysis
All water samples were filtered using pore size = 0.45 mm membrane. Fluorescence spectroscopy was scanned using an FL-4600 fluorescence spectrophotometer (Hitachi High Technologies, Tokyo, Japan). An ultra-pure water as a blank sample was subtracted from water samples. Rayleigh and Raman scatter was also removed following the literature [26]. Fluorescence region integration (FRI) used in this study was to evaluate fluorescence component, which was developed by Chen et al. [27]. It shows that a two-dimensional fluorescence region includes five components including aromatic protein-like materials denoted as I, aromatic protein-like materials denoted as II, fulvic acid-like materials denoted as III, soluble microbial metabolites denoted as IV, humic substance-like materials denoted as V. Their variations were investigated during chlorination. A detailed calculation of the standard integral volume of ith fluorescence region was as follows:
where I is fluorescence intensity; λex and λem are excitation wavelength (nm) and emission wavelength (nm), respectively; φi,n (au.nm2) is standard integral volume corresponding to ith fluorescence region; αi is a ratio of the integral volume of all regions to the integral volume for the ith region.
2.3. Chlorination
An experiment to investigate chlorination (chlorine consumption) is either undertaken over seven or three days. In this study, we used a three-day chlorine consumption, which was conducted following the process used by Chu et al. [13], and performed in the dark for three-day reaction period. Water samples were added to 50 ml centrifugal tube and pre-determined amount of sodium hypochlorite solution was pipetted into the tube. In order to obtain a better chlorination, the pH of the samples were buffered at pH 7.5 with NaHCO3 buffer solution. The demand for disinfectant dosage was also determined by the Eq. (2) for free chlorine, which was added to ensure removal of any natural occurring ammonia [13, 28, 29].
The experiment was conducted so that the residual free chlorine existed within chlorination time. Subsequently, the residual free chlorine was eliminated through a quenching agent (ascorbic acid) in order to stop chlorination reaction. The samples were collected and measured for free chlorine using a HACH DPD free chlorine kit and HACH DR/2800 colorimeter.
3. Results and Discussion
3.1. Water Characteristics Dependence
The water samples including the Yuehu lake water, landfill leachate water, pond water, Xiangjiang River water and sewage effluent were analyzed. These waters’ DOC values, NH3-N values, chlorine consumption amount were observed as shown in Fig. 1.
Fig. 1 shows the results of chlorine consumption of the water samples. Landfill leachate water, pond water and Yuehu lake water are more complex more than the Xiangjiang river water and the sewage effluent including higher organic matter. Some polluted water is discharged into the Yuehu Lake and high levels of algae are found in pond water. Diluted landfill leachate water included a 3.62 mg/L DOC but its NH3-N was significantly higher than other water sources. Although Yuhue Lake water had a relatively higher DOC at 4.48 mg/L, the chlorine consumption by landfill leachate was three times than that of the Yuehu Lake water. With the similar level DOC and NH3-N values, the Yuehu Lake water could consume more chlorine than the Xiangjiang River water although Xiangjiang River had a significantly higher turbidity level and NO3− and NO2−. In addition, sewage effluent water had a higher DOC value and a similar NH3-N value to the Yuehu Lake water, whereas the chlorine consumption of the Yuehu Lake water was higher than that of the sewage effluent. As seen from the results, the DOC and HN3-N had a significant influence in chlorination consumption. However, this was not consistent across all samples. These implied that chlorine consumption depended on other water characteristics. In general, chlorine dose is used to kill bacteria, oxidation of organic matter or reducing inorganic matter [12]. The residual chlorine dose was not included in chlorine consumption. In different water environments the levels of bacteria are different, and organic matter in addition to DOC includes dissolved nitrogen compounds, as well as varied levels of other inorganic components such as NO3− and NO2−. Therefore, the different water environments are characterized by multiple component variation leading to a varied chlorine consumption.
3.2. Fluorescence of Chlorinated Samples
DOM fractions from different water sources always vary in composition. Although fluorescence only relates to a small portion of organic matter in water, it correlates with a wider range in water quality parameters such as DOC [30], chemical oxidation demand (COD) [31] and biological oxidation demand (BOD) [32]. Therefore, it has the potential to enhance the correlation between chlorine consumption and organic matter and become a useful component of the consumption model. In this study, FRI includes five fractions: aromatic protein-like materials denoted as I, aromatic protein-like materials denoted as II, fulvic acid-like materials denoted as III, soluble microbial metabolites denoted as IV, and humic substance-like materials denoted as V. After chlorination, EEMs changed significantly (see Table 1), especially the intensity of individual fractions. As a result, many characteristic peaks disappeared, implying the fluorescence groups were broken. Percentage removal of FRI fractions as shown in Fig. 2 indicated that it was the smallest for sewage effluent less than 60%, while the highest value occurred in the Yuehu Lake, followed by Xiangjiang River and pond water. Yuehu Lake water had a similar DOC values and NH3-N values to Xiangjiang River, but it produced a higher chlorine consumption and removal in the level of the FRI fractions. The organic matters showed the fluorescence signal and those other environmental variables to be possible to correlate with the chlorine consumption. For example, the chlorine dosage that landfill leachate consumed was the highest, whereas its change in fluorescence was not the most significance, which would be affected by other environmental variables such as NH3-N.
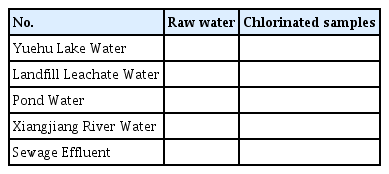
Variations of Fluorescence Spectra during Chlorination

Percentage removal of FRI fractions after chlorination.
3.3. Chlorine Consumption Model
The DOC, turbidity, NH3-N, NO3−, and NO2− are all the related environmental factors influencing the potential formation of DBPs and chlorine consumption [14]. We assumed a relationship between these factors and the chlorine consumption following the multi-linear regression model as follows.
Where QCl2 is chlorine consumption; a is regression constant; ki is regression coefficient of ith factor; fi is the ith factor.
The f was divided into three components: Cl2-dependence factors (CDF) to determine the amount of chlorine for chlorination process including DOC and NH3-N, denoted as f1; other background water matrix (BWM) including temperature, pH, NO3−, NO2− and turbidity, denoted as f2; five fluorescence fractions of NOM (FFN), denoted as f3. In the absence of the components f and f-contained factors, the sensitive of the components to the model was tested by measuring the square correlation coefficient (R2) between measured Q values and predicted. Because the f data had a significant dimension difference, we pre-treated the data as logarithmic values. Those data could not be tested out was defined as zero value. The experimental results are shown in Fig. 3.

(a) Sensitivity of f1, f2 and f3 to model, (b) Sensitivity of f1 and f2, f1 and f3, and f2 and f3, to model, (c) results of measured vs. predicted using f1, f2, and f3. f3 and Δf3 stands for the FRI fraction amount of raw water samples and the difference between the f3 and those of the chlorinated samples. The measured and predicted values were the logarithmic chlorine consumption values.
Fig. 3 shows the results of f components to the model. In Fig. 3(a), the results show the fit with f1, f2, and f3, respectively and with R2 values of 0.71, 0.72 and 0.41 respectively. It was difficult to obtain a good result with f3 alone, which showed that fluorescence fractions in the model could not predict chlorine consumption very well. However, coupling with other variables it does to improve the prediction accuracy significantly. For example, as illustrated in Fig. 3(b), with the f3 and the f1, the R2 was up to 0.79, increasing the prediction accuracy with f1 by 11% and with f3 by 48%. The main reason for the enhancement would be that the fluorescence fractions relate to the fluorescence signal of some components of the organic matter which do not strongly relate to absolute DOC and NH3-N values, and may relate to the protein-like material fractions more strongly correlated to dissolved organic nitrogen compounds [22, 32], thus new information was added to the model. With the f1 and the f2, the R2 was up to 0.81, increasing the prediction accuracy with f1 by 14% and with f2 by 12.5%; with the f2 and the f3, the R2 was up to 0.72, increasing the prediction accuracy with f3 by 43% but not effective for enhancing the prediction accuracy with f2. This showed that fluorescence was a good predictor when combined with the inorganic components and is applicable to the DOC and NH3-N component. As illustrated in Fig. 3(c), the combination of f1, f2, and f3 or Δf3 was able to enhance the R2 significantly up to 0.80 or 0.82. These findings showed that the combination of components are better than individual components; fluorescence fraction could enhance the performance of the model with the f3. It seems beneficial to use the coupling of f1, f2 and f3, which requires more detail of the water composition.
4. Conclusions
The source water can be purified by chlorination during water treatment, but at the same time, the chlorination process also has the potential to produce significant disinfection by-products. These by-products are harmful and a risk to human health. In order to alleviate the impact of these hazards, the control of chlorination process is particularly important. Therefore, monitoring the correlation among water characteristic parameters, chlorine consumption and chlorine dose is an important process to guide the analysis of water treatment system. In this study, the chlorine consumption of different water bodies was assessed to show the potential for treatability. The relationship between chlorine consumption and background water matrices including Cl2-dependence factors (CDF), other background water matrices (BWM) and the fluorescence fractions of NOM (FNN) was investigated using a multi linear regression model. The FNN is not effective in enhancement of the BWM response to the model but it could enhance the model with CDF by 11.26%. The combination of the CDF, BWM and FNN or that of the CDF and BWM, or CDF and FNN were both effective parameters in prediction of chlorine consumption.
Acknowledgment
This work was supported by the Natural Science Foundation of Hunan Province of China (grant number 2018JJ2128), and the China Postdoctoral Science Foundation (grant number 2017M622578), and the National Natural Science Foundation of China (grant number (51,408,215).
Notes
Author Contributions
G.C.Z. (Associate Professor) wrote and revised the manuscript. S.S.Z. (master student) and Y.B. (Master student) conducted all the experiments and wrote the manuscript. A.S.H. (Professor) reviewed manuscript.