Characteristics of long-range transported PM2.5 at a coastal city using the single particle aerosol mass spectrometry
Article information
Abstract
Air pollution has attracted ever-increasing attention because of its substantial influence on air quality and human health. To better understand the characteristics of long-range transported pollution, the single particle chemical composition and size were investigated by the single particle aerosol mass spectrometry in Fuzhou, China from 17th to 22nd January, 2016. The results showed that the haze was mainly caused by the transport of cold air mass under higher wind speed (10 m·s−1) from the Yangtze River Delta region to Fuzhou. The number concentration elevated from 1,000 to 4,500 #·h−1, and the composition of mobile source and secondary aerosol increased from 24.3% to 30.9% and from 16.0% to 22.5%, respectively. Then, the haze was eliminated by the clean air mass from the sea as indicated by a sharp decrease of particle number concentration from 4,500 to 1,000 #·h−1. The composition of secondary aerosol and mobile sources decreased from 29.3% to 23.5% and from 30.9% to 23.1%, respectively. The particles with the size ranging from 0.5 to 1.5 μm were mainly in the accumulation mode. The stationary source, mobile source, and secondary aerosol contributed to over 70% of the potential sources. These results will help to understand the physical and chemical characteristics of long-range transported pollutants.
1. Introduction
Atmospheric particulate matter (PM), particularly the fine particulate matter (PM2.5), has become a serious problem around the world, because of its numerous adverse effects on individuals and universal climate [1]. The World Health Organization (WHO, http://www.who.int) reported in 2016 that PM led to 3,700,000 deaths per year, most of which died of respiratory diseases. PM2.5 is a mixture of minor particles and liquid droplets. It consists of metals, organic chemicals, acids (such as nitrates and sulfates), and dust particles. The smaller particles are more harmful to human health [2]. The particles in the accumulation mode (0.1–2.0 μm) have the maximum extinction coefficient and the longest residence time, so they can be transported over long distances [3]. Pollution types can mainly be divided into two categories: transport type and cumulative type. The transport pollution type is characterized by direct external transport [4, 5].
As noted in previous research, off-line monitoring is a widely-used method for PM mass analyses [6]. However, this method has been found to have deficiencies in many aspects, such as low resolutions, the sampling pollution and a poor efficiency [7]. The aerosol mass spectrometers (AMS), the aerosol time-of-flight mass spectrometry (ATOFMS) and the single particle aerosol mass spectrometer (SPAMS) with high temporal resolution have already been used to monitor aerosols on-line to acquire the physicochemical characteristics of PM [8]. In recent years, the SPAMS has been broadly used in aerosol research in Asia based on the laser ablation and ionization methods [7, 9]. It can record size and mass spectral information on single particle. Therefore, the SPAMS can be used to reveal the PM formation process from Aitken mode [10], and to predict quantitatively the PM chemical mixture state [8]. Besides, it could benefit the determination of the PM potential sources [11, 12]. The mixture state can be influenced by both emission sources and meteorological conditions, such as cloud condensation nuclei, hygroscopicity, and optical scatter and absorption [13]. The source apportionment is a major achievement of SPAMS [14]. Many studies using the SPAMS indicated high PM2.5 mass concentration in the Yangtze [14] and Pearl River Delta regions [7], the Sichuan basin [15], the Beijing-Tianjin-Hebei region [16] and Central China [9].
In recent years, the SPAMS has been used to characterize the haze pollution in China based on the particle number concentrations. However, the research on the mixture state, size distribution and evolution processes of long-range transported aerosol particles are still insufficient. The main purpose of this study is to further investigate the rapid variations of chemical compositions, size and sources of fine particle during the formation and dissipation processes of haze, which was caused by the long-range transported pollutants. Therefore, it could help to improve the understanding on haze evolution.
2. Experiment Methods
2.1. Sampling Site
Fuzhou is the capital as well as the political and economic center of Fujian Province, China. The annual average mass concentration of PM2.5 in Fuzhou in 2015 was 29.2 μg·m−3 (https://www.aqistudy.cn/historydata/daydata.php). It was below the Grade II National Ambient Air Quality Standard (35 μg·m−3) for the annual mean concentration of PM2.5. However, the daily average mass concentration of PM2.5 was high, up to 94.1 μg·m−3 on January 19th in 2016 during a haze episode. The monitoring site is situated on the rooftop of an office block in Fujian Environmental Monitoring Station (119.29 ºE, 26.11 ºN), which is situated in a typical governmental and residential area with large residential and traffic sources (Fig. S1). More detailed information of this site has been mentioned in a previous study [17].
2.2. SPAMS and Meteorological Data
A commercial device of SPAMS (Hexin Analytical Instrument Co., Ltd., China), previously described by Li et al. [18], was utilized in this study. The particles with aerodynamic sizes of 0.2–2.0 μm from the ambient air can be acquired into the vacuum system through a critical orifice (~ 100 μm), and then through an aerodynamic lens, and gradually focused on the axis of the lens. They were finally quantified by two photomultiplier tubes (PMTs) based on the speed of the particles and their passing time. Sized particles (noted with ‘size’) are ionized by a pulsed Nd (266 nm): YAG laser (1.0 mJ). A bipolar TOF-MS was used to detect and quantify the positive and negative ions (noted as ‘mass’). However, the SPAMS has a low ionization efficiency for particles below 0.2 μm or above 2.5 μm.
A total of 1,314,931 particles (‘size’) and 169,687 of the particles (‘mass’) were collected by SPAMS during the haze episode in Fuzhou from 17th to 22nd January, 2016. PM2.5, sulfur dioxide (SO2) and nitrogen dioxide (NO2), were continuously monitored during 17th and 22nd January, 2016. Daily average PM2.5 mass concentration was calculated based on hourly average data. Meteorological data including air temperature (T), relative humidity (RH), visibility (Vis), and wind speed (WS)/wind direction (WD) was obtained from the website of the weather company (https://www.wunderground.com, an IBM Business, formerly WSI).
2.3. Analysis of Single Particle Data
A Matlab-based data analysis toolkit for SPAMS (COCO_P) was used to search and dispose of mass spectral features of particles. The particles were further categorized via neural network algorithm (ART-2a) based on the similarity of mass spectra with vigilance factor, learning rate, maximum iteration and range of mass spectra of 0.8, 0.05, 20 s, and 250, respectively [19]. The particles were manually clustered into six groups (95% of whole particles number), i.e. EC (element carbon) based on Cn± (n = 1,3,4,5 …), organic carbon (OC) based on high signal levels of 27, 43 (m/z) along with peaks near 50 (m/z) and peaks near 60 (m/z), K-rich based on high signal levels of 39 (m/z), heavy metals based on signal peak of Pb (206, 207, 208), Zn (64, 66, 68), Cu (63, 65), etc., dust based on signal peak of Ca+ (40) and SiO3− (−76), and secondary aerosol based on high signal levels of nitrate (−46, −62) and sulfate (−80, −97). The remaining unclassified particles were considered as others. All the particles should only be classified into one potential source.
2.4. Potential Source Contribution Function
The meteorological data used in the model on source determination were obtained from the NOAA FNL archives. A tracking time of 48 h was adopted in this study with hourly trajectories from 0:00 to 23:00 between 16th and 22nd January, 2016. The starting height of 500 m above the ground level (AGL) was used to lessen the effects of ground surface friction and to characterize the wind features in the lower boundary layer [20]. Trajectory clustering was performed with the geographic information system (GIS) based on the software of TrajStat [21]. Potential source contribution function (PSCF) methods were applied to study the potential source regions and the individual contributions to PM2.5 in Fuzhou in January, 2016. PSCF could reflect the proportion of pollution trajectory in a grid, and it is impossible to distinguish the contribution of the grid with the same PSCF value to the mass concentration of PM2.5 at the sampling site. The 48 h air mass back-trajectories arriving at the Fujian Environmental Monitoring Station were simulated using the NOAA HYSPLIT4 model based on the global data assimilation system (GDAS) data at 0.5°× 0.5° resolution. Back trajectories were generated hourly during the study period, and started at 500 m above ground level. PSCFij is defined as follows:
where nij is the total number of trajectory endpoints in the ijth grid cell and mij is the total number of trajectory endpoints in the same cell with the pollutant concentrations at the sampling site being higher than a criterion value. A weighting function was applied to reduce the PSCF values when the total number of the endpoints in a particular cell was less than about three times the average value of the end points per cell. Wij was defined as follows:
As shown in Fig. 1, the major potential source region (PSCF value > 0.4) contributing to the particles at the study site was mainly in the northwest, especially in the Yangtze River Delta (including Shanghai, Jiangsu, and Zhejiang), which was consistent with the results derived from the back-trajectory analyses (Fig. S2).
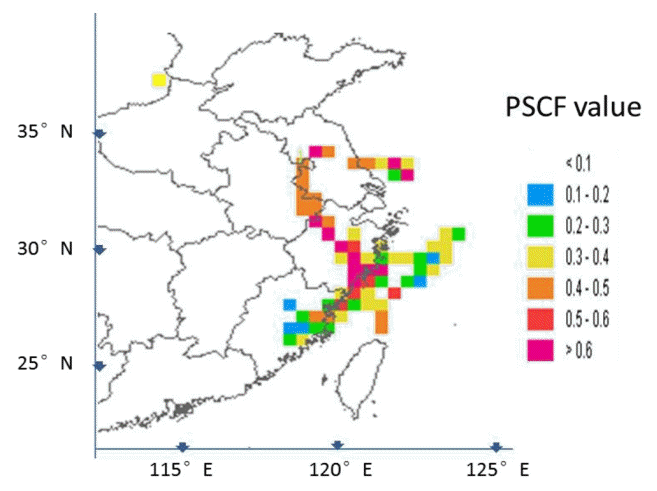
Air mass (based on the 72 h backward trajectories) calculated by the HYSPLIT4 model and TrajStat in Fuzhou (119.29 ºE, 26.11 ºN) at the height of 500 m AGL.
The Nested Air Quality Predicting Modeling System (NAQPMS) is a multi-scale air quality modeling system technologically advanced by the Institute of Atmospheric Physics, Chinese Academy of Sciences (IAP, CAS), and it aims to reproduce the transport and evolution of air pollutants. This system includes modules of real-time emission, dry and wet statement, aerosol, gaseous phase, and heterogeneous atmospheric chemical reaction [22]. The model is in nested domains, which covers East China with 15 km × 15 km horizontal resolution and has 180 grids in the latitudinal and longitudinal directions, respectively. The time from 16th to 22nd January was selected with a 5-min time step in this study. The species involved in PM2.5 included sulfate, nitrate, ammonium salt, black carbon (BC), and dust. The initial and boundary conditions were engaged in the results of a global model (MOZARTv2.4), which was jointly developed by the American Nation Center for Atmospheric Research (NCAR), the Max Planck Institute for meteorology, Germany (MPI), the Global Fluid mechanics research Laboratory (GFDL), and the American Nation Oceanic Atmosphere Administration (NOAA). Fig. 2 illustrated that the air masses were mainly originated from the north. It also showed the daily average concentration of PM2.5 in East China and its transport fluxes. It was found that the surface PM2.5 concentration remained high in Shanghai in the Yangtze River Delta region under northerly winds, with the level over 75 μg·m−3. The pollutants in Shanghai were transported southward to Zhejiang province (Fig. 2, and Fig. S4.). During this period (18th–20th January, 2016), the prevailing northerly winds in Shanghai and Zhejiang gradually brought PM2.5 northwardly to Fujian province along the coastline under a weak pressure system in the East China Sea (Fig. S3). Therefore, the pollution process could be identified as the transport type, and it could be inferred that the particulate matter was carried to Fuzhou from the north of the study site. This model could clearly show the locations of the pollution sources.
3. Results and Discussion
3.1. Overview of the Air Quality and Meteorological Parameters
The SPAMS results and meteorological parameters were presented in Fig. 3(a) showed that the T kept decreasing and the RH kept increasing during the formation (T1) and dissipating (T2) periods of aerosols, which created good conditions for a sharp increase of PM2.5 concentration [23]. Fig. 3(b) clearly showed that the WS increased quickly during T1 and then remained at a high level, while it rapidly decreased during later T2. Besides, the wind originated mainly from northwest of the sampling site during T1 and T2. Higher PM2.5 concentration was observed under relatively high WS Fig. 3(b) and 3(c), which differed from the results of Lu and Fang [24]. They found that the PM2.5 mass concentration was negatively correlated with WS during cumulative period. Long-range transported air pollutants might play a main part in the increase of PM2.5 concentration during the study period in Fuzhou, which was consistent with the previous research of Grange et al [25]. They discovered that the highest concentrations of PM2.5 were related with strong easterly winds during long-range transport, while elevated PM2.5 concentrations could also be observed under low WS. In other words, low WS could lead to the buildup of high local pollutant concentrations while strong ventilation with high WS could prevent the local build-up near the sources, but contribute to long-range transport of regional aerosol, especially under directionally persistent wind conditions [26].
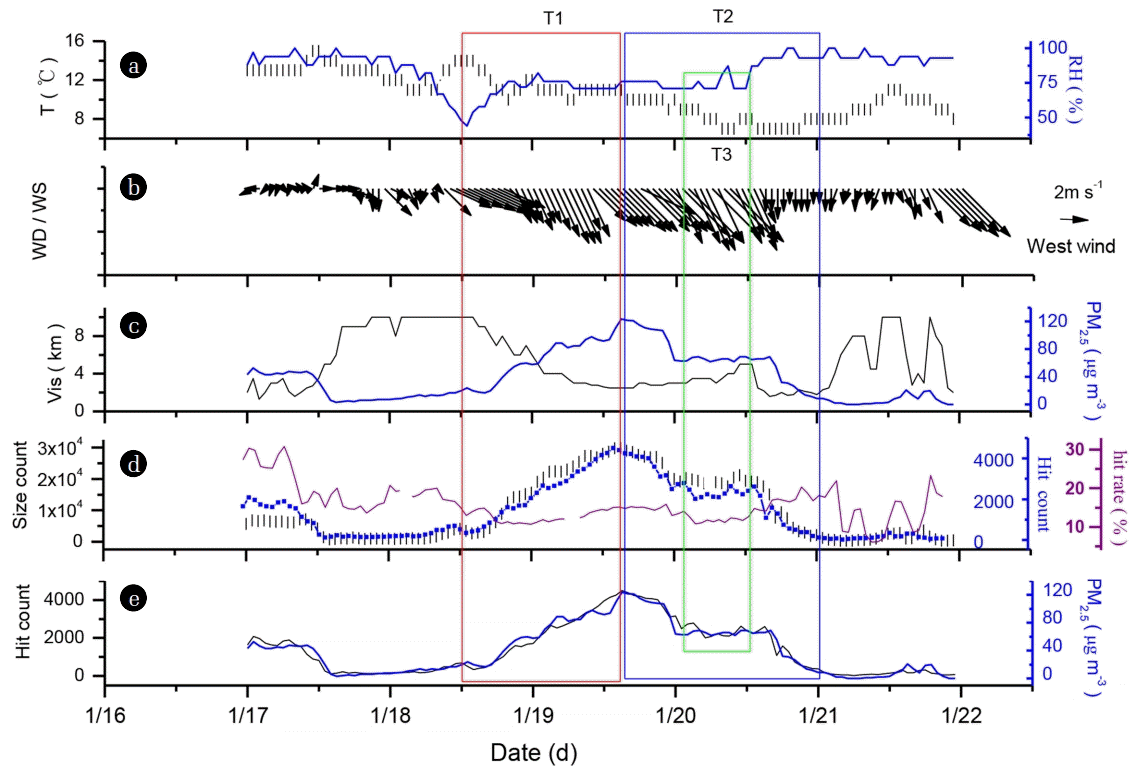
Time series of (a) T and RH; (b) WS and WD; (c) atmospheric Vis and PM2.5 mass concentration; (d) number of sized particles, hit count, and the hourly average hit rate of SPAMS; (e) mass concentration and the hourly average hit count from 16th to 22nd January, 2016.
The Vis and PM2.5 concentration presented inverse correlation (Fig. 3(c)), which was consistent with the previous research [27]. Low Vis (< 4 km) was observed when PM2.5 mass concentration was above 75 μg·m−3, indicating the occurrence of haze [28]. The highest PM2.5 mass concentration was up to 124 μg·m−3 during the episode. The number of ‘sized’ and ‘mass’ and the hourly hit rate of SPAMS were depicted in Fig. 3(d). The hit particles well tracked the PM2.5 mass concentration (Fig. 3(e)), which was in accordance with the results reported by Reche et al [29]. It suggested that the particle number concentration could correlate well with PM2.5 level and could be used as an indicator of pollution levels.
3.2. Major Particle Types from Mass Spectral Analysis
Mass spectra of the six groups with descriptions of each type were shown in Fig. 4 and Table S1. The relatively high intense signals at m/z 39 (K+), and m/z 37 (C3H+), which was organic fragment as the typical biomass burning (BB) marker, were collected in the positive ion signals this study. This was similar to the result reported by Tao et al. [30] BB particles collected were relatively aged due to high ion signals at m/z −46 (NO2−), −62 (NO3−) and −97 (HSO4−), which suggested that they reached the sampling site with deeply aged state. The large fraction of biomass particles might be due to the pulluatant transportation from North area of the study region, which was consistent with the results based on back trajectory (Fig. S2) and model analyses (Fig. 2). As shown in Fig. S5, the correlation coefficients between BB and OC were more than 0.7, which suggested that BB and OC have a good correlation.
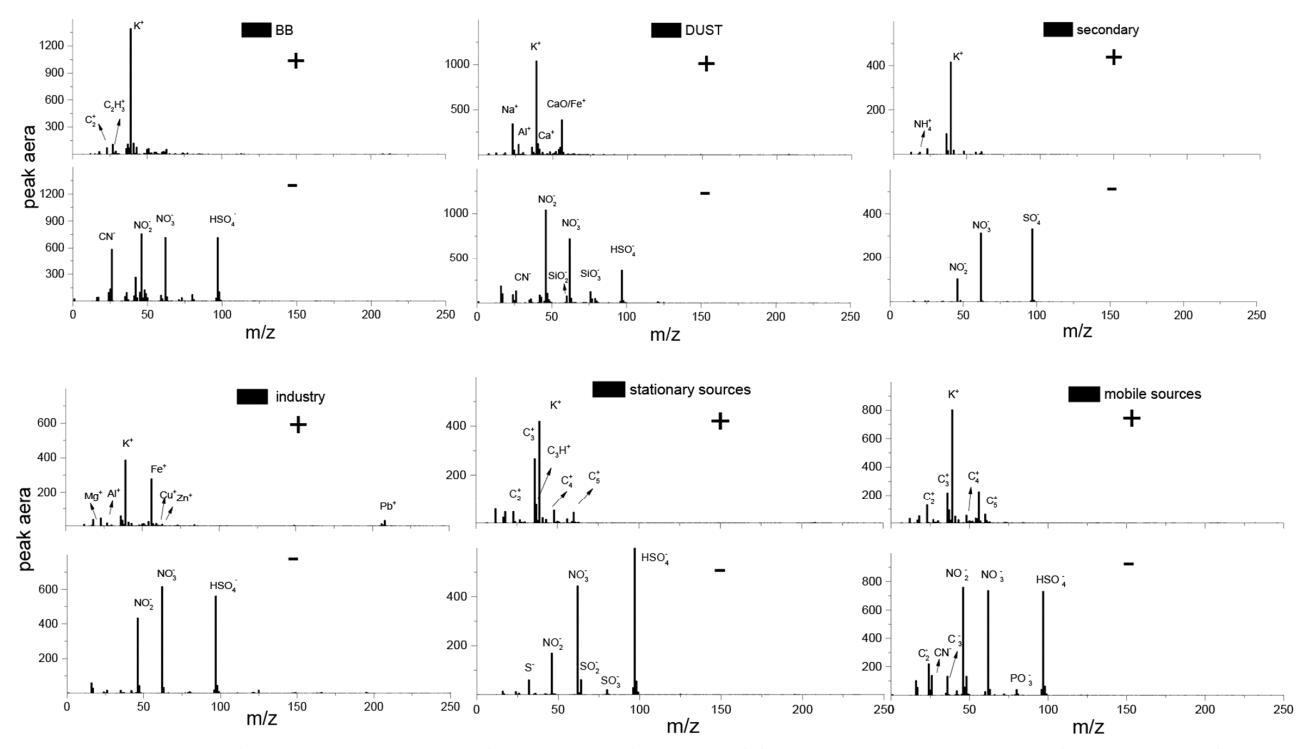
Average positive and negative mass spectra of the six groups: dust, BB, mobile sources, stationary sources, industry and secondary aerosol.
Dust particles showed relatively high nitrate −62 (NO3−) and sulfate −97 (HSO4−) signals, which suggested that they were aged particles. This was consistent in the result that more than 50% of dust particles contained aged particles shown in the Fig. S5. The positive ion signal at m/z 56 should be CaO+ instead of Fe+ due to high signal intensity at both m/z 40 (Ca+) and m/z 56.
The mass spectra of mobile sources are indicated by Cn+ (n = 1, 2…7) and CnHm+ (n = 1–5, m = 1–3) in the positive mass spectrum and strong secondary ions in the negative mass spectrum, especially the m/z −46 (NO2−) and m/z −62 (NO3−). This suggested that the aged EC particles were probably in a mixture state with nitrate. Furthermore, the organic nitrogen m/z 26 (CN−) and m/z 39 (K+) were also observed.
Strong peaks of inorganic ions were observed at m/z 39 (K+) in the positive spectrum and at m/z −97 (HSO4−), −80 (SO3−), −64 (SO2−) and −32 (S−) in the negative spectrum, which might belong to aged particles as suggested by Lang et al. [31] Strong mass peaks of Cn± (n = 1, 2…7) were observed in the positive and negative mass spectrum as the stationary sources. As shown in Fig. S5, more than 80% of the stationary sources contained elemental carbon (EC), suggesting a good relation between stationary sources and EC.
Intense ion signals of m/z 206/207/208 (Pb+), 64/66/68 (Zn+), 63/65 (Cu+), and 24 (Mg+) were observed in industrial particles, with high peaks at extremely aged m/z −46 (NO2−), −62 (NO3−) and −97 (HSO4−) in the negative mass spectra.
The secondary particles were characterized with intense 39 (K+) and other ions with low peaks in the positive spectra and −97 (HSO4−), −46 (NO2−), −62 (NO3−) in the negative spectra. The particles of sulfate and nitrate are commonly considered as secondary type in spite of the particles were emitted from the primary sources, such as sea salt and industry [7].
3.3. Chemical Characteristics of Particles
As shown in Fig. 5, PM2.5 mass concentration rapidly increased from 35 to 124 μg·m−3 during T1 (formation period) but decreased quickly during T2 (dissipating period). During T1, obvious increases were observed in the fractions of mobile source (from 24.3% to 30.9%), and secondary aerosol (from 16.0% to 22.5%), and the number concentration also rapidly increased from 1,000 to 4,500 #·h−1. It could be seen from Fig. S3 that the particles with increased number concentration mainly came from north of the monitoring site. Based on these results, we concluded that the contributions to aerosols from both mobile source and secondary aerosol increased during T1. Combined with the backward trajectory analysis (Fig. S2), air quality modelling (Fig. 2) and wind direction and speed information (Fig. 3(b)), the increase in the fraction of mobile source was regarded to be caused by local vehicle emission or regional transport from northern China.
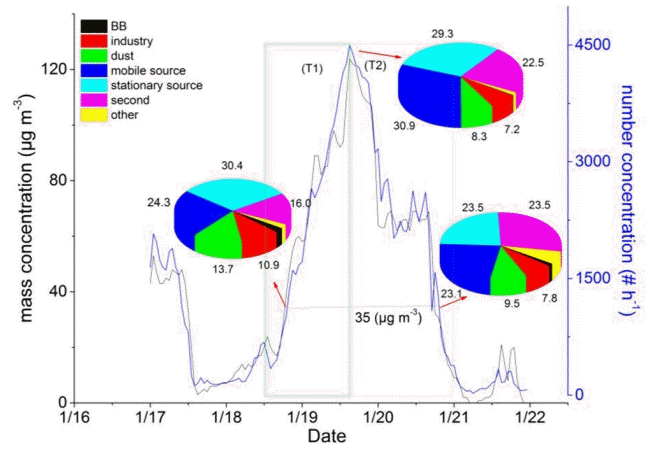
Hourly resolved numbers of fine particles by SPAMS, and PM2.5 mass concentration fraction of chemical compositions during different periods in Fuzhou.
Fig. 5 and Fig. 3(b) showed that PM2.5 number concentration rapidly increased from 1,000 to 4,500 #·h−1 during T1 with relatively strong wind (maximum WS at 10 m·s−1), which was contrary to the general understanding that elevated particle concentration is usually associated with low WS [32]. This positive relationship between pollutant concentration and WS, which suggested the negative effect of pollutant transport on local air quality during the period of T1, had also been confirmed by the modeling result (Fig. 2) and seen from the Fig. S3. Therefore, the process during T1 was inferred to be a long-range transported process rather than an accumulation process.
During T2, the fraction of stationary sources decreased from 29.3% to 23.5% and the fraction of mobile sources decreased from 30.9% to 23.1%. In the meantime, the number concentration also rapidly decreased from 4,500 to 1,000 #·h−1. Therefore, the reduced contributions from both stationary and mobile sources were the main reason for the haze dissipation. Fig. 3(b) and 3(c) showed that sea breezes mostly blew from northeast with clean air, which could dilute the pollutants by carrying them to south. This indicated that meteorological factors were the main contributors to haze dissipation.
As shown in Fig. 6, the number concentrations of SO42− and NO3−, and PM2.5 concentration decreased quickly since January 20. These might be due to the dilution effect of the relatively clean air originating from the sea (Fig. S4). However, during T3 period, when a slight change in wind direction was recorded, an obvious increasing trend was observed for SO2 (with a maximum value of 12 μg·m−3). Unlike other pollutants, SO2 was mainly emitted from stationary sources. The short distance between the sampling site and a local industrial park (Fig. S1) with small coal-fired power plants, which were likely strong sources for SO2, might account for the abnormal rise of SO2 during this period. More effort is still needed to confirm this in the future.
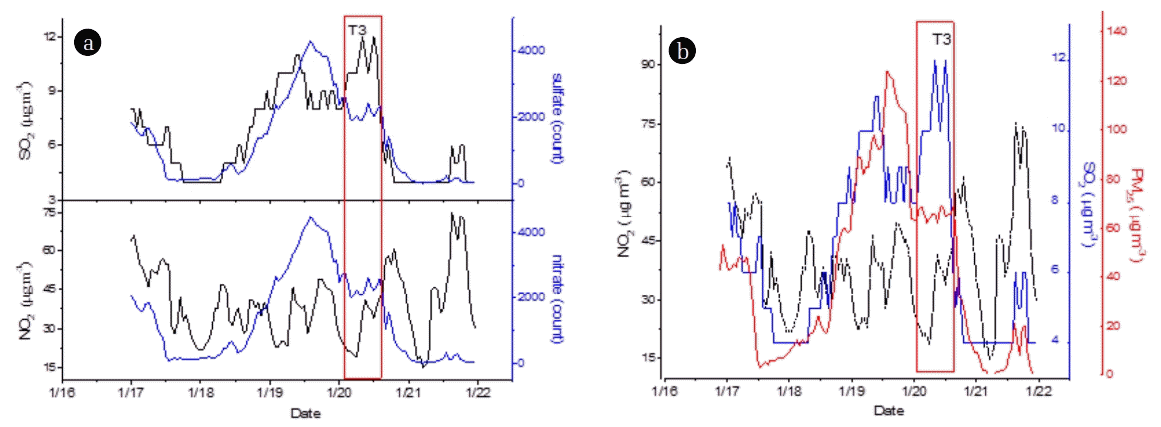
Temporal variations of mass concentration of SO2, NO2 and PM2.5, and number concentration of nitrate and sulfate.
In summary, PM2.5 number concentration rapidly increased from 1,000 to 4,500 #·h−1 during T1 (formation period) with the increasing secondary aerosol, which might result from OH· photo-oxidation of particles and their homogeneous or heterogeneous reactions during long-distance transport. During T2, the number concentration rapidly decreased from 4,500 to 1,000 #·h−1 due to the dilution effect of clean sea breezes blowing mainly from northeast to south.
NO2 is often used as the marker for mobile/traffic emissions [25]. The mobile sources were plotted against the NO2 concentrations in Fig. S6, which showed a relatively good linear correlation with R of 0.73 for the whole study period. As the local emissions and long-range transport may have significantly different characteristics, these correlations may vary accordingly. Based on previous discussion, the air quality at the study site was regarded to be strongly influenced by the long-range transported air pollutants during the periods of T1 and T2, while it was mainly influenced by local emissions during other time periods. Therefore, the correlations were greatly improved, with R values increasing to 0.95 and 0.85 for periods when the sampling site was affected by the long-range transport and local emissions, respectively. These suggested that the source apportionment for the mobile source emissions was generally reliable.
3.4. Size and Number Distributions of the Particulate Matter
Fig. 7(a) and 7(b) illustrated that the number concentrations of mobile source, stationary source and secondary aerosol increased quickly during haze formation. During the dissipation period, the number concentrations of mobile source, stationary source, and secondary aerosol gradually decreased. During this haze episode, the total particle numerical proportion of the stationary source, mobile source and secondary aerosol was almost 80%, indicating that they were the main sources of pollution. This was in accordance with the study by Zhou et al [33]. As shown in Fig. 7(c), the particle of the pollution process was mainly distributed from 0.5 to 1.5 μm. Fig. 8 presented the size distribution of particle number concentration for different components during the study period. The six components, which accounted for more than 80% of the total particle number, were mainly distributed from 0.5 to 1.5 μm. The previous research [34] reported that the particles of the nuclear mode (0.005–0.1 μm) could be condensed and converted into those of the accumulative mode (0.1–2.0 μm) during long-range transport. The smaller the particles are, the slower they will deposit due to their longer retention time and transport distance in the atmosphere. Different compositions in different particle size have different proportions, which are closely related to the occurrence, disappearance, migration and transformation of atmospheric particulates. Also the pollution process during the study period had been confirmed to be the long-range transported type based on previous modeling analyses. It was shown that the proportions of secondary aerosols and mobile sources decreased with the increase of the particle size in the range of 0.6 to 1.8 μm (Fig. 7(d)). Based on the analyses of the size-fractioned aerosol samples collected by eight-stage Anderson samplers for four seasons, Zhang et al discovered that the size distributions of SO42− and NH4+ fraction were almost unimodal when the T was high during all seasons, in contrast, those of Mg2+ and Ca2+ appeared bimodal in the lower T [35]. The proportion of stationary emission sources gradually increased in the range of 0.6 to 1.8 μm, which was consistent with the previous research [36]. As shown in Fig. 7(d), the proportion of the three pollution sources was about 80% in this range, indicating that the three pollution sources were the main contributors to the haze formation. The dust accounted for high proportion of particles in the size of less than 0.5 μm, while the secondary and stationary aerosols accounted for relatively low proportions. Besides, the proportion of stationary sources was higher than that of dust in the size of 1.5–2.0 μm. These suggested that the fine particles might have been oxidized and changed in size during the long-range transport. This result could provide a basis for making air quality control policies and help to improve the air quality in a specific region.

Particle number and fraction of different sources with a, b) 1-h time resolution, and c, d) 0.25 μm resolution in particle size during the experimental period.
4. Conclusions
This study investigated the single particle chemical composition and particle size of ambient aerosol using the SPAMS in Fuzhou, China from January 17th to 22nd, 2016. The haze formation was mainly caused by the long-range transported air pollutants from the Yangtze River Delta region to Fujian Province along the coastline. During the formation period of haze, the fraction of mobile source (secondary aerosol) increased from 24.3% to 30.9% (from 16.0% to 22.5%), and the number concentration elevated from 1,000 to 4,500 #·h−1. On the other hand, the haze was eliminated by the clean air mass from the sea, which led to the decrease of particle number concentration from 4,500 to 1,000 #·h−1. The fraction of secondary aerosol decreased from 29.3% to 23.5% and the fraction of mobile sources decreased from 30.9% to 23.1%. The six major components (K-rich, EC, OC, sulfate, ammonium, and nitrate) of the particles accounted for more than 80% of the total particle number. The particle size was mainly in the range of 0.5–1.5 μm, which belonged to the accumulation mode. Average positive and negative mass spectras of the six potential sources (dust, BB, mobile sources, stationary sources, industry, and secondary aerosol) were identified to gain a deep insight into the chemical composition and mixing state of each pollution source. The major potential sources were stationary source (23.51–30.39%), mobile source (23.06–30.91%) and secondary aerosol (16–23.49%), with the total proportion exceeding 70%. More than 80% of stationary sources, mobile sources, industry, and secondary aerosol contained K-rich, nitrate, and sulfate.
Supplementary Information
Acknowledgments
Thanks to the National Key Research and Development Program (NO.2016YFE0112200) and the Chinese Academy of Sciences Interdisciplinary Innovation Team for funding the research.


