1. Introduction
A two-chamber microbial fuel cell (MFC) is the most common type of MFC, where an anode chamber and a cathode chamber are divided by a separator [1, 2]. Since terminal electron acceptors (TEAs) are provided as they are dissolved in a catholyte, the two-chamber MFC is appropriate for analyzing the effect of the TEA on the MFC [3, 4]. The electron donors that are commonly used in an MFC are organic materials contained in sewage, and oxygen in the air is usually used as a TEA as it may be supplied conveniently. The MFC using oxygen as a TEA employs a chemical catalyst such as platinum (Pt) at the cathode to increase the low reduction rate of oxygen, and this greatly increases the power generation [5]. On the other hand, the MFC using nitrate as a TEA usually employs a biocatalyst, which gives less power generation than the MFC using oxygen as a TEA but is favorable for application to sewage treatment, as it is easily able to remove nitrogen from the sewage [6]. Gregory et al. [7] first reported that the microbes in MFCs receive electrons directly from the cathode to reduce nitrate to nitrite. Many studies have been conducted on the development of nitrogen removal MFCs that accompany nitrification and denitrification using a biocathode (a cathode with a biofilm) and nitrate as a TEA. Virdis et al. [8] removed ammonia by adding an external nitrification reactor and nitrate in a two-chamber MFC for denitrification. However, they reported decreasing total nitrogen (T-N) removal efficiency in the effluent as the ammonia injected to the anode chamber was transported through the cation exchange membrane (CEM) to the cathode chamber. To prevent the outflow of ammonia through the CEM, Virdis et al. [9] applied simultaneous nitrification and denitrification (SND) to an MFC where both nitrification and denitrification occurred simultaneously at the cathode chamber. Zhang and He [10, 11] used a dual-cathode MFC where one anode is shared by two cathodes (aerobic and anaerobic) to remove nitrogen, and applied an anion exchange membrane (AEM) between the anaerobic cathode, the outflow part, and the anode. T-N removal efficiency is dependent on the separators because nitrogen in water exists as cations (NH4+) or anions (NOx−).
A two-chamber MFC should separate the anolyte from the catholyte and allow the transport of hydrogen ions (H+) generated at the anode chamber to the cathode chamber [12]. A proton exchange membrane (PEM), originally developed for hydrogen fuel cells, was usually used in early studies of MFCs, but a CEM or an AEM is generally employed at present because of the high price and the limiting hydrogen permeability of the PEM if there are other kinds of cations in sewage and wastewater [13]. In an MFC using oxygen as a TEA, the coulombic efficiency (CE) and the power generation are decreased as the oxygen supplied to the cathode is diffused to the anode through the separator [14]. Similarly, the electrochemical properties of a nitrogen removing MFC may also be dependent on the separation membrane, because the ammonium (cation) and nitrate (anion) existing in water may be transported to another chamber through the CEM and the AEM, respectively.
The purpose of the present study is to investigate the nitrogen removal and electrochemical characteristics of a MFC using nitrate as a TEA. For this, an MFC using a biocathode cultured by using the same seeding sludge was compared with a two-chamber MFC using oxygen as a TEA, and the nitrogen removal and electrochemical characteristics depending on the separator were analyzed by using an AEM and a CEM. Because the acetate commonly used in a MFC as a substrate exists as anions, as in the case of nitrate, it can move through the AEM. This paper proposes the application approach of MFC for the wastewater treatment system by evaluating the electricity generation and pollutant removal rate according to the possibilities of migration of substances through the separator.
2. Materials and Methods
2.1. Microbial Fuel Cell Components
The MFC used in this study has a cubic-shaped cylindrical chamber prepared by using acrylic resin, corresponding to the reactor used by Logan’s group, and the liquid volume of each chamber is 28 mL [15]. The separators were an AEM (AMI-7001, Membrane International Inc., USA) and a CEM (CMI-7000, Membrane International Inc., USA). As shown in Fig. 1, the MFCs using nitrate as a TEA employed an AEM (AN-MFC) and CEM (CN-MFC), and the MFC using oxygen as a TEA employed an AEM (AO-MFC). Both the anodes and cathodes were a carbon fiber brush (Mill-Rose, USA, diameter and length of 25 mm and 50 mm). Before being used, the electrodes were thermally treated at 450°C for 30 min, and the separators were immersed in a 5% NaCl solution in a thermostat at 40°C.
2.2. Operating Conditions
The medium injected to each chamber consisted of NaCl 0.5 g, MgSO4 0.015 g, CaCl2 0.02 g, KH2PO4 0.53 g, K2HPO4 1.07 g, and trace element 1 mL (per liter of deionized water), where the trace element was prepared via the same method as Park et al. [16]. Sodium acetate (350 mg COD/L) was added as an electron donor to the medium for all the anode chambers. KNO3 (40 mg NO3−N/L) was additionally injected to the medium for the AN-MFC and CN-MFC, while air was continuously injected at 5 mL/min to the medium for the cathode chamber of the AO-MFC.
For enrichment of the biofilm, the electrodes were immersed in the return sludge (about 8,000 mg MLSS/L) of S public sewage treatment plant for two weeks before being used in the MFCs. The MFCs were operated by batch-test in a room with temperature controlled at 25°C. The medium was replaced with a new medium after a designated operation time by removing the existing medium and injecting a new medium. The external resistance was 100 Ω in all the experiments.
2.3. Electrochemical and Chemical Measurement
The voltage generated at the MFC was measured by using a digital multimeter (Keithely-2700, USA) with an interval of 30 min, and the current (I, A) was calculated by dividing the measured voltage (E, V) by the external resistance (R, Ω) (I = E/V). The power (P, W) was calculated as a product of the measured voltage and the calculated current (P = IE), and the current density (A/m3) and the power density (W/m3) were calculated with reference to the cathode chamber volume (28 mL) [14].
The power curve and the polarization curve were obtained through linear sweep voltammetry (LSV) by using a potentiostat (Interface 1000, Gamry Scientific, USA). The LSV was operated as an open circuit for two hours after replacing the medium. The open circuit voltage (OCV) was then measured by using the potentiostat, and the current was measured at a scan rate of 1 mV/s. In the measurement, the working electrode (WE) was the anode, and the counter electrode and the reference electrode (RE) were the cathodes.
Cyclic voltammetry (CV) was carried out by using the potentiostat to measure the electrochemical activity of the biocathode of the AO-MFC. CV was performed by a three-electrode method where an Ag/AgCl electrode (RE-5B, USA, 209 mV vs SHE) was used as an additional RE, and WE was the cathode and counter electrode was the anode. The RE was placed in the cathode chamber to reduce the internal resistance with the WE. The scan rate for the CV was 20 mV/s, and the scanning range was from −200 mV to 300 mV vs Ag/AgCl. The CV was performed in an open circuit for the biocathode of the AO-MFC, and a carbon fiber brush without a biofilm was used as the control group.
The CE refers to the ratio of the theoretical coulomb calculated as the amount of removed substrate to the coulomb represented by the generated current. The CEC and CEN, the organic material-based and nitrate-based CEs of the MFC, were calculated by using Eq. (1) and (2), respectively, and the ratio of electrochemical denitrification and heterotrophic denitrification can be calculated on the basis of the calculated CEN [11]. It is expressed as follows:
where Ms and Mn are the molecular weight of the substrate (oxygen based on COD = 32 g/mol) and nitrogen (14 g/mol), respectively. Iave is the average current density (A/m3). tb is the reaction time (s). F is Faraday’s constant (96,485 C/mol e−). bes and ben are the number of electrons exchanged per mole of oxygen (4 mol e−/mol) and nitrogen (nitrate = 5 mol e−/mol and nitrite = 3 mol e−/mol), respectively. ΔCOD and ΔNOx are the concentration removed (g/L).
COD, NH4+-N, and NO3−-N were measured to evaluate the organics and nitrogen removal efficiency of the MFC. The samples were filtered with a 0.45 μm membrane, and test kits (Humas Company, Korea) were used for the measurement. For COD, 2 mL of the sample was injected to a test kit, which was heated at 150°C for two hours and then cooled at room temperature to measure the concentration. The HS-COD-LR (15–150 mg/L) kit was used to measure the COD concentration of the influent and effluent. The NH4+-N concentration was measured by using a HS-NH3-(N)-H (2–60 mg/L) kit based on the Nessler method, and the NO3−-N concentration was measured by using a HS-NO3-(N)-CA (0.5–30 mg/L) kit based on the chromotropic acid method.
3. Results and Discussion
3.1. Voltage Generation of Microbial Fuel Cell during the Start-up Periods
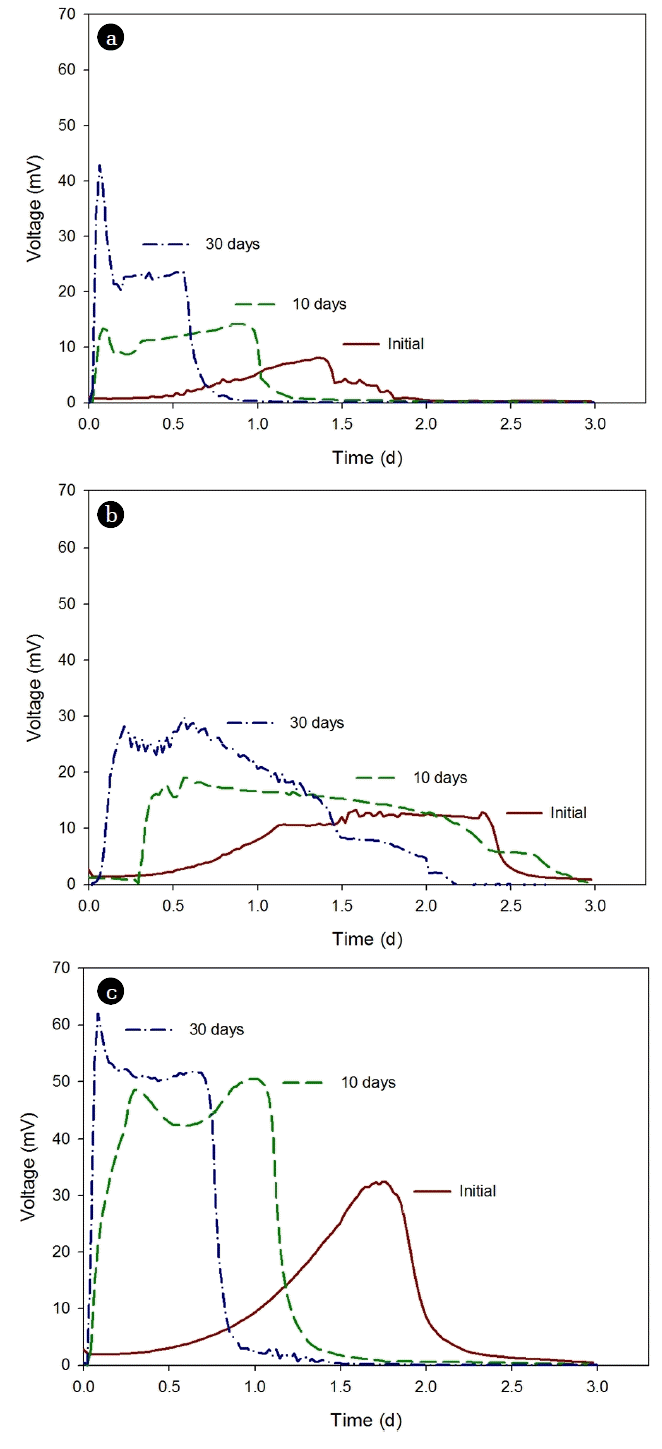
The MFCs were operated by installing the electrodes, which were immersed in the return sludge to form a biofilm, and injecting the medium. As shown in Fig. 2, generation of a voltage over 1 mV was started after operation of the MFC operation for 12 h. The maximum voltage of the MFCs in the early stage of operation was from 8.2 mV to 32.5 mV between 31 to 40 h of operation. For the MFCs using nitrate as a TEA, the maximum voltage was lower in the AN-MFC with the AEM than in the CN-MFC with the CEM (Fig. 2(a), (b)). The highest maximum voltage was found in the AO-MFC using oxygen as a TEA (Fig. 2(c)). In all the MFCs, the voltage was decreased below 1 mV after 43 to 68 h of operation. The medium was replaced after 72 h. After ten days of operation, the maximum voltage of the MFCs was between 14.2 mV to 50.5 mV, which was on average 1.5 times higher than that in the early stage of the operation. The maximum voltage was high in the order of AO-MFC, CN-MFC, and AN-MFC, as in the early stage of operation. The maximum voltage was found after 13 to 22 h following the medium replacement, which was earlier in general in comparison with the early stage of operation. The voltage was decreased below 1 mV after 28 to 40 h of operation in the MFCs except for the CN-MFC. In the CN-MFC, the voltage was decreased below 1 mV after 69 h, which was similar to the early stage of operation.
After 30 d of operation, the voltage generation became stable in all the MFCs, and the maximum voltage was increased 2.4-fold on average in comparison with the early stage of operation. The highest maximum voltage was found in the AO-MFC using oxygen as a TEA (62.0 mV), while the maximum voltage of the AN-MFC and CN-MFC, using nitrate as a TEA, was 42.9 mV and 29.8 mV, respectively. The maximum voltage was found before six hours of operation in all the MFCs. The voltage was decreased below 1 mV after 48 h in the CN-MFC, while it decreased below 1 mV before 24 h of operation in the AO-MFC and AN-MFC using an AEM. The characteristics of the voltage generation were dependent on the TEA and the separators of the MFCs. However, as the operation time was increased, the maximum voltage was increased and a relatively constant voltage was generated. This indicates that electrochemically active bacteria became dominant on the biofilms of the anode and the cathode. The MFC using the AEM showed a shorter voltage generation time than the using the CEM. This could decrease the start-up period compared to the CEM when the medium is replaced upon the voltage decreasing below 1 mV.
3.2. Electrochemical Characteristics of MFCs According to the TEA
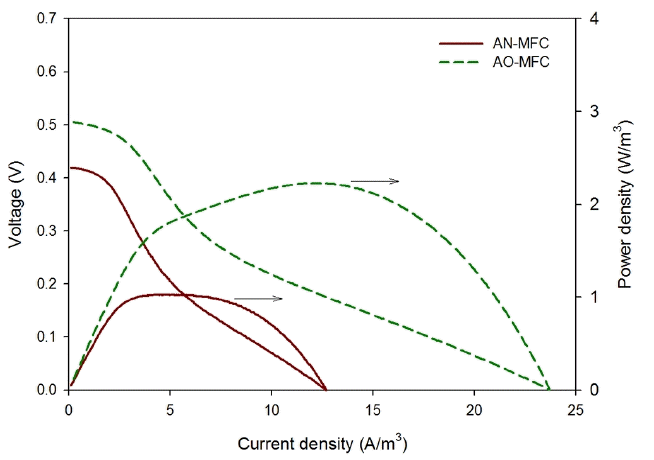
The AN-MFC and AO-MFC were operated under the same operation conditions, except for the TEAs, which were nitrate and oxygen for the AN-MFC and AO-MFC, respectively. As shown in Fig. 3, the OCV of the AN-MFC was 0.42 V, which was lower than that of the AO-MFC (0.51 V). The voltage generated at an MFC is the potential difference between the anode and the cathode, which may be estimated from the redox potential of the reaction formula. The anode potential of the AN-MFC and AO-MFC was −0.28 V, as shown in Eq. (3), and the cathode potential of the AN-MFC was +0.74 V (Eq. (4)), which were lower than the value (+0.82 V) of the AO-MFC (Eq. (5)). Virdis et al. [17] conducted a batch experiment where oxygen and nitrate were used as a TEA and they reported that the measured anode potential was similar regardless of the TEA. Hence, in the present study, the lower OCV in the AN-MFC compared to that in the AO-MFC may be due to the difference in the redox potential of the reaction formula. The reaction formulas are expressed as follows:
The maximum power density of the AN-MFC was 1.0 W/m3 at a current density of 4.9 A/m3, which was lower than the maximum power density of the AO-MFC (2.2 W/m3, 12.3 A/m3). Similarly, the maximum current density was lower in the AN-MFC (12.7 A/m3) than in the AO-MFC (23.7 A/m3). This verified that the power generation by the MFC using the biocathode was less when nitrate was used as a TEA than when oxygen was used. Clauwaert et al. [6] reported that an overpotential limiting the reduction rate was generated at a higher current with a biocathode using nitrate compared to the case using oxygen. Therefore, the maximum current density was lower in the AN-MFC due to this overpotential.
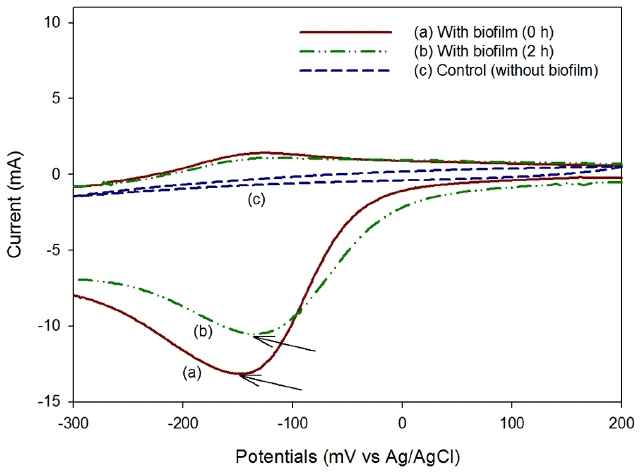
CV was performed to investigate the activity of the biocathode in the AO-MFC. As shown in Fig. 4, in the forward scanning (from 200 mV to −300 mV vs Ag/AgCl) of the voltammograms, the reduction peaks can be observed at around −148.9 mV at −13.1 mA of current in the early stage of operation, and they decreased to −133.9 mV (at −10.5 mA) after two hours of operation. In the backward scanning of the voltammograms, no reduction peak was found. In addition, a reduction peak of the cathode without a biofilm (carbon fiber brush) was not found in forward scanning or in backward scanning. This distinctive difference in the reduction peak depending on the formation of a biofilm was reported by Liu et al. [15] and indicates that electrons are directly transported between the cathode and the microbial community formed on the cathode. They also reported that CV under open circuit showed no reduction peak (or no oxidation peak). Therefore, it was determined that electrons are directly transferred between the cathode and the microorganism in the AO-MFC. The phyla found in their biocathode are Betaproteobacteria, Bacteroidetes, Actinobacteria, etc. [18–19]. Chen et al. [20] reported that, among those, Betaproteobacteria had the greatest probability to utilize oxygen or nitrate in the cathodic compartment without external mediators. Therefore, the biocathode in not only the AO-MFC but also the AN-MFC and CN-MFC may be dominated by Betaproteobacteria.
3.3. Nitrogen Removal Characteristics According to the Separators in Two-chamber MFC
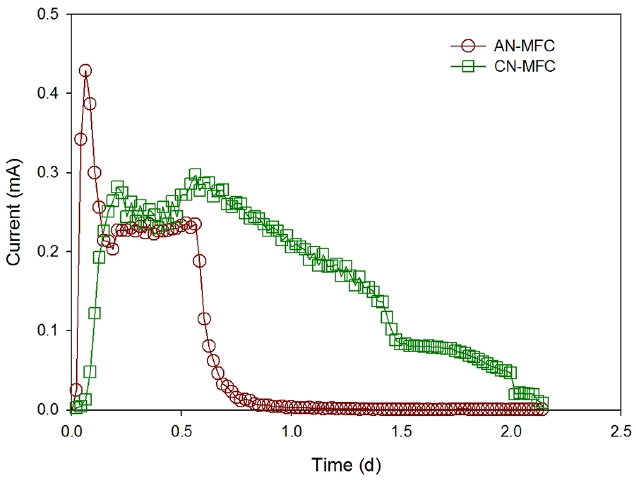
All the conditions for the AN-MFC and CN-MFC were the same except the separators, which were an AEM and a CEM for the AN-MFC and CN-MFC, respectively. The substrate and the TEA used in the experiment are acetate and nitrate, which exist as anions, as shown in Eq. (3) and (4), and may be transported from the anode chamber to the cathode chamber through the AEM. As shown in Fig. 5, the maximum current was higher in the AN-MFC (0.43 mA) than in the CN-MFC (0.30 mA), but the average current (over 0.01 mA) generated from the AN-MFC was 0.18 mA, which was not significantly different from the value (0.17 mA) from the CN-MFC.
When the voltage was decreased below 0.01 mA, the COD reached the detection limit (below 15 mg/L) in the AN-MFC and CN-MFC, and more than 95% of the nitrate was removed in both of the MFCs. The rate of COD removal and denitrification of the AN-MFC were 420 kg/m3·d and 0.048 kg/m3·d, respectively, which were higher than those of the CN-MFC (0.148 kg/m3·d and 0.019 kg/m3·d). On the contrary, CEN and CEC of the AN-MFC which were 31.2% and 11.9%, respectively, were lower than those of the CN-MFC (CEN = 96.1% and CEC = 40.4%) (Table 1). The substrate (CH3COO−) and TEA (NO3−) of the AN-MFC is an anion, which can migrate from the anode chamber to the cathode chamber, and vice versa through the AEM. Heterotrophic denitrification, in which organics are oxidized and NO3− is reduced to N2 by heterotrophs, may occur when the substrate and the TEA are present in the chamber at the same time. This presents a higher nitrate removal rate than electrochemical denitrification in MFC, while the CE decreased by competing with organic oxidation for electricity generation [21]. The CN-MFC was showed little heterotrophic denitrification due to inhibited migration of the substrate and TEA. As a result, it showed a higher CE and a lower removal rate of COD and nitrate than the AN-MFC. The low denitrification rate is one of the major bottlenecks of practical application and scale-up of MFCs. It is though that this can be addressed by AEM utilization to improve the denitrification rate.
4. Conclusions
The present study was conducted to investigate the nitrogen removal and the electrochemical characteristics of two-chamber MFCs for denitrification, and the following conclusions were obtained from the experimental results. In the biocathode MFCs using an AEM, the maximum power density was about 40% lower in the MFC using nitrate as a TEA than in the MFC using oxygen as a TEA. The CV analysis of the biocathode MFC using oxygen as a TEA showed a distinctive reduction peak due to the biofilm formation, indicating that electrons were directly transported between the microorganisms and the electrodes. The MFC for denitrification using an AEM allows acetate (CH3COO−) as a substrate and nitrate (NO3−) as a TEA to be transported to opposite sides of the chamber through the AEM. As a result, heterotrophic denitrification and electrochemical denitrification occurred simultaneously at the anode and the cathode, increasing the COD removal rate and the denitrification rate. On the other hand, the MFC for denitrification using a CEM allows the transport of acetate and nitrate. Accordingly, oxidation of organics oxidation and electrochemical denitrification occurred at the anode and the cathode, respectively. Therefore, the CE was higher but the COD removal rate and the denitrification rate were lower in the MFC using a CEM than in the MFC using an AEM.


