AbstractThe electrical energy consumption (EEC) in removal of NO by a UV/H2O2 oxidation process was introduced and related to removal efficiency of this gas. The absorption-reaction of NO was conducted in a bubble column reactor in the presence of SO2. The variation in NO removal efficiency was investigated for various process parameters including NO and SO2 inlet concentrations, initial concentration of H2O2 solution and gas flow rate. EEC values were obtained in these different conditions. The removal efficiency was increased from about 22% to 54.7% when H2O2 concentration increased from 0.1 to 1.5 M, while EEC decreased by about 70%. However, further increase in H2O2 concentration, from 1.5 to 2, had no significant effect on NO absorption and EEC. An increase in NO inlet concentration, from 200 to 500 ppm, decreased its removal efficiency by about 10%. However, EEC increased from 2.9 × 10⁻² to 3.9 × 10⁻² kWh/m3. Results also revealed that the presence of SO2 had negative effect on NO removal percentage and EEC values. Some experiments were conducted to investigate the effect of H2O2 solution pH. The changing of pH of oxidation-absorption medium in the ranges between 3 to 10, had positive and negative effects on removal efficiency depending on pH value.
1. IntroductionNitrogen oxides (NOx) as a part of gaseous air pollutants produced as a result of motor vehicles traffic and fossil fuel combustion processes. These gases along with sulfur dioxide are known as acid rain-causing pollutants [1–4]. The development of new and effective technologies for simultaneous removal of these hazardous pollutants has become a major research direction in gas purification field [5]. NO comprises more than 90% of NOx emitted from power plants, especially in countries which use fuel oil [2]. Wet flue gas desulfurization (FGD) technologies are the most common and high-efficient ones applied for SO2 removal [1]. Although, conventional FGD technologies have high sulfur dioxide removal efficiency and low cost, but because of the low solubility of NO in aqueous solutions, these methods cannot effectively remove NOx [6–10]. Some methods such as adsorption, SCR and SNCR have been developed for NOx reduction. In the most cases, the pollution sources emit the several pollutants at the same time to the atmosphere. Controlling these hazardous gases emissions at separate units often requires sophisticated equipment and exorbitant costs. Applying single effective equipment which is capable of simultaneous removal of multi pollutants will be an unavoidable necessity in becoming years [11–14]. It is likely that, in 2020, almost 60% of the total coal-fired capacities utilize some type of wet-FGD techniques. Therefore, it is desirable that these technologies could be capable to remove simultaneously the nitrogen species along with SO2 without need to install additional costly control equipment such as SCRs [8]. The most important advantage of this method, as compared with SCR, would be a large saving in capital cost [15]. However, NO must be oxidized to higher oxidation states (NO2, HNO2 and HNO3) which are more easily soluble in aqueous solutions and can be removed by alkaline absorbents [16–18]. The most well-known NO oxidants are ClO2 or O3 which are, however, highly expensive as well as very dangerous for equipment especially in gas phase operations [16]. The majority of scientific works are based on using H2O2 as oxidation reagent because it is known as a lower cost and environmental friendly oxidant [17]. The major operating cost for the ozone oxidation process is the cost of electricity for ozone generation and expensive ozonizers [18]. The energy consumed for ozone synthesis, using air as a feed, ranges from 22 to 33 kWh/kg O3, including air handling and ozone contacting with water. The energy requirement for ozone production from pure oxygen is also in the range from 12 to 18 kWh/kg O3. The cost of oxygen should be added. However, the electrolytic process for producing H2O2 consumes approximately 7.7 kWh per 1 kg of H2O2 produced [19]. Some complex agents such as FeIIEDTA, FeII(CYS)2 and CoIII(en)3 and sono-chemical oxidation have been used to improve the absorption rate of NO in solutions [6, 7, 16, 19–21]. The use of these chemicals and methods often involves high costs and technical problems. Other oxidation agents such as NaClO2, KMnO4, Na2S2O8 are also capable of converting NO into higher oxidation states. However, due to the formation of toxic by-products such as ClO2 or insoluble products such as MnO2 and the high cost of reagents, these oxidants may be not suitable for large-scale industrial applications. In the other word, H2O2 is the most suitable oxidant that can be used practically for simultaneous removal of SO2 and NO in terms of cost and environmental impact [5].
Although advanced oxidation processes (AOPs) such as UV/H2O2 are widely applied in wastewater treatment [22, 23], but recent findings show that such processes are also could be suitable alternative to conventional methods in gas purification field. UV light/H2O2 [24, 25], persulfate/heat/light/ultrasound [14, 26] and UV/Fenton-like reactions [10] are some examples of the most studied AOPs for gas purification, especially simultaneous removal of NO and SO2. The application of UV or Vacuum Ultraviolet (VUV) combined with other chemical compounds such as Peroxymonosulfate (PMS) and KHSO5 has been also studied by some researchers [27, 28]. AOPs are based on producing an active strong oxidant species such as hydroxyl radicals which can simultaneously oxidize and remove gaseous pollutants. UV/H2O2 process can be used for simultaneous oxidation of SO2 and NOx into sulfuric and nitric acid, respectively. This is usually a safe and simple process with no secondary pollution generation. UV light is applied to excite H2O2 and produce strong hydroxyl radicals [3, 4, 11, 12, 21, 25, 29–31].
Applying AOPs in gas separation and purification is nearly a new subject. Photo-oxidation removal methods (e.g., AOP) have demonstrated good development prospects in the area of emission reduction of NOx and SO2 from flue gas. However, more comprehensive research should be conducted to effective implementation of such processes as an alternative to conventional technologies in gas pollution control. Experimental and especially theoretical studies in this field are still in early stages of progress. The author’s pervious work is one the first researches on the theoretical aspects of UV/H2O2 AOP focusing on the mathematical modeling [32]. Liu et al. [3] also conducted a study on mass transfer-reaction kinetics of UV/H2O2/NaOH process for simultaneous removal of NO and SO2. They developed a simple rate equation for NO absorption based on mass transfer-reaction parameters such as gas phase mass transfer coefficient.
There are very little researches focused on comparing the AOPs in terms of energy consumption or economic feasibility. Mahamuni et al. [33] studied different types of AOPs in the field of water/wastewater treatment from economic point of view with calculating operation, maintenance and capital cost and considering figure- of-merit (Electrical Energy per Order (EE/O)) as one of the operation cost components. In the field of gas purification AOPs the term of energy consumption should be described in different manner which is one the objects of this work. In the present study the influence of operation parameters on the nitric oxide absorption through a UV/H2O2 process in a bubble column reactor was investigated. The term of electrical energy consumption (EEC) in gas purification field was introduced for the first time. This term can be nearly equivalent to the term of figure-of-merit defined in water treatment processes. Calculation of the EEC, at least, is necessary to compare the AOP in the term of energy consumption cost. It also can provide the required information for scale-up and economic analysis for comparison with other technologies for gas purification. Therefore the introduction and definition of this term is valuable for the future research on AOP performance estimation in the field of gas separation.
2. Experimental Setup and Procedure2.1. Experimental Setup
Fig. 1 shows experimental setup comprising a bubble column reactor, gas blending and gas analyzing system. The NO removal efficiency (or absorption rate) was investigated for various process parameters such as H2O2 initial concentration (0–2 molar), gas flow rate (450–750 mL/min), NO inlet concentration (200–500 ppm), SO2 concentration (400–1,000 ppm) and solution pH (3–10).
2.1.1. Gas blending systemTo prepare simulated flue gas, three gas cylinders, three mass flow controllers (MFCs, Brooks Instrument), and a gas mixer were used. SO2 (purity 99.5%) and NO gas cylinders (99.5%) supplied from FARAFAN Gas Company, Iran (Representative of Technical Gas, Dubai, United Arab Emirates) and N2 gas cylinder purchased from DENA gas (Isfahan, Iran). The flow rates of SO2 and NO were controlled by their MFCs and the desired concentrations were obtained by adding N2 through the third flow controller. The maximum flow rates of MFCs were 2.5, 3 and 1,000 mL/min for SO2, NO and N2, respectively. Then the gases directed through pipelines into a mixing chamber to achieve complete mixing. All pipes, valves, regulators, and fittings were made up of SS-316 which was well compatible with the used gases.
2.1.2. Bubble column reactor with UV light sourceThe bubble column reactor was made of glass with a diameter of 5 cm and height of 25 cm equipped with a jacket heat exchanger to maintain the desired temperature (room temperature) through the experiments. An aquarium bubble maker served as bubble generator at the reactor bottom. The reactor was operated in semi-batch mode and the generated gas bubbles were continuously passed through a fixed-volume liquid bed. The radiation source was a mercury UV lamp (Philips, power 6 W, wavelength 254 nm) with quartz sleeve placed at the reactor center. This leads to a uniform light distribution within the small annular space.
2.1.3. Gas analyzing systemBefore entering the reactor, to ensure the desired composition, the simulated flue gas was passed through a sampling line (valve 13) embedded to gas analyzing chamber and was analyzed by a gas analyzer. Then the valve 13 was closed. The concentrations of gaseous pollutants at the reactor outlet were also measured using the gas analyzer by opening the valve 14. This valve was opened during the experiment runs to continuously measure the outlet concentration of SO2 and NOx. The analyzer was a TESTO 350 XL gas analyzer (Germany) with the specifications summarized in Table S1 (See supplementary data).
2.2. Experimental ProcedureThe absorption-reaction environment was a H2O2 solution. In each experiment, depending on the required H2O2 concentrations, 300 mL of solution were prepared with double-distilled water and a 30 wt % H2O2 solution (Merck). To investigate the effect of initial pH of reaction environment, in some experiment, the initial pH of solution was adjusted by adding a NaOH solution (0.5 M). In all experiments, the solution pH before and after the tests was measured by a pH meter (Model SL. 901, Sana, Iran, accuracy ± 0.01). Initial pH was held at 3.2 (2 molar H2O2 solution), except for experiments performed at different H2O2 concentrations. The flow rates for each gas were adjusted based on maximum allowable MFCs flow rates and desired gas concentrations. After solution temperature became stable, the simulated flue gas entered into the reactor by opening the valve 15 and the absorption process started with turning on the UV lamp. Each run lasted 1,800 s, the valve 14 also was opened and the outlet concentrations of gaseous pollutants were recorded to calculate removal efficiency according to Eq. (1) in this work.
where, η is final removal efficiency, CNO,in and CNO,out are inlet and final outlet concentrations of NO, respectively. All concentrations are in ppmv.
3. Results and DiscussionThe results were presented based on the absorption rate or removal efficiency at different experimental conditions in the following sections. The SO2 removal efficiency was nearly complete. Therefore, the results are not shown here.
3.1. Effect of H2O2 Initial Concentration on Removal Efficiency and EEC ValuesThe results shown in Fig. 2 and Table 1, reveal that this parameter has a significant impact on NO absorption-oxidation reaction during the UV/H2O2 AOP. The removal efficiency and absorption rate increase when H2O2 concentration increases from 0.1 to 1.5 mol/L. However, a further increase in H2O2 concentration, from 1.5 to 2 mol/L, has no considerable effect on NO removal efficiency and its absorption rate. H2O2 can directly react with NO based on Eq. (2) and oxidize this gas to HNO3. Furthermore, according to Eq. (3), H2O2 is the key agent of photochemical reaction. Under constant UV light radiation, an increase in H2O2 concentration can enhance the photolysis reaction yield and also promote the rate of direct oxidation of NO with OH radicals based on Eq. (4). Therefore, NO absorption increases from 0.73 × 10⁻⁴ to 1.82 × 10⁻⁴ when H2O2 concentration increases from 0.1 to 1.5 M. According to Eq. (1), the removal percentage also increases because of a decrease in NO outlet concentration. However, further increases in H2O2 concentration may lead to some side reactions and producing OH scavengers (see Eq. (5) to (8)) finally reducing NO absorption and removal efficiency [4, 20, 29, 31, 34].
In this section the parameter of EEC is defined according to the specifications of the AOP in gas purification processes. EEC is described as the electrical energy in kilowatt-hours (kWh) consumed to activate 1 m3 of an oxidant solution which is used for the removing of a pollutant gas in a bubble column reactor containing moving gas bubbles. Considering first-order mass transfer-reaction kinetics for NO removal [29], this term is defined as Eq. (9). Unlike conventional AOPs (water/air treatment), here, the pollutant should be transformed from gas bubbles into the liquid phase to react with oxidation solution. The pollutant removal occurs during the time period which gas bubbles pass through the reactor length and energy consumption should be related to gas phase residence time (tb).
where, EEC is electrical power consumption (kWh/m3), P is UV lamp power (W), and v is oxidant solution volume (m3), C0 and C are inlet and outlet concentration of NO (ppm), respectively. Average gas bubbles residence time can be calculated from gas hold-up (ɛg) and gas superficial velocity (ug). Gas hold-up which is volume fraction of gas phase occupied by the gas bubbles can also be obtained from the increase in the height of the solution after gas injection. Therefore, Eq. (10) is used to calculate the gas hold-up [13, 35].
where, Z0 and Zb are liquid height in the reactor before gas injection and after expansion, respectively. Then, the average gas bubbles residence time is calculated by Eq. (11) [13, 35].
where, ug is superficial gas velocity (cm/s) calculated from total gas flow rate and reactor surface area. Vg (cm3) and Qg (cm3/s) are the gas hold-up volume and gas flow rate, respectively. The values of the parameters used to calculate EEC are presented in Table 2.
As can be seen from Fig. 2, when H2O2 concentration increases from 0.1 to 1.5 M, the EEC decreases from 12.2 × 10⁻² to 3.8 × 10⁻² kWh/m3. As mentioned, H2O2 concentration directly affects photolysis reaction and amount of OH radical produced. Therefore, at a constant UV lamp power, an increase in H2O2 concentration means higher removal efficiency and consequently the lower EEC. However, further increase in H2O2 concentration has no considerable effect on NO removal percentage and EEC value as explained before. In other words, there is a maximum amount of H2O2 where the removal efficiency not affected by H2O2 concentration. Therefore the energy consumption term is not improved with an increase in H2O2 concentration.
3.2. Effect of Gas Flow Rate on NO Removal Efficiency and EEC ValuesAs can be seen from Fig. 3, NO removal efficiency is decreased from 67% to about 52% when gas flow rate increases from 450 to 750 mL/min. The results are consistent with those of obtained by other researches which their finding confirm the decreasing trend for NO removal efficiency [11, 12, 24]. Fig. 3 also reveals that, the values of EEC are higher at higher flow rates and EEC increases by about 20% when gas flow rate increases from 450 mL/min to 750 mL/min. According to data from Table 2, as gas flow rate increases the gas-liquid contact time decreases which leads to higher NO outlet concentrations and consequently lower removal efficiencies. However, it should be mention that the NO absorption rate increases from 1.56 × 10⁻⁴ to 2.2 × 10⁻⁴ (see Table 1) because the gas phase mass transfer coefficient increases with gas flow rate as shown in Table 2. The volumetric gas phase mass transfer coefficients are calculated from experimental data of SO2 absorption (inlet concentration = 700 ppm) in NaOH solution (0.1 M) at different flow rates and then converted to mass transfer coefficient for NO gas, according to Wang et al. [36]. However, because of the effect of flow rate on removal efficiency which is appeared in Eq. (9), the energy consumption increases. Therefore, increasing the gas flow rate is not desirable from economic point of view and process efficiency.
3.3. Competitive Absorption of NO in Presence of SO2: The Effect on Removal Efficiency and EEC ValuesSO2 solubility in aqueous solutions is larger than that of NO and can more quickly reach reaction zone and competes with NO in consuming OH radicals or H2O2 according to Eq. (12)–(13) [3, 4, 20, 29, 37]. As data in Fig. 4 and Table 2 show, the NO removal efficiency and absorption rate decrease when SO2 concentration increases from 0 to 1,000 ppm. In addition to SO2 high solubility, according to the Liu et al. [37] the hydrolysis reactions of SO2, based on Eq. (14) and (15), can lead to an increase in its absorption compared with that of NO. Also, according to the Eq. (16)–(19) the hydrolysis products of SO2, including HSO3− and SO32−, can also be further oxidized and reacted by ·OH free radicals and H2O2, leading to a further increase in the SO2 absorption rate compared to that of NO [3, 4, 20, 29, 37].
Fig. 4 also confirms the competing effect of the presence of SO2 on EEC. With increasing SO2 inlet concentration and decreasing the removal percentage, the EEC significantly increases. As SO2 inlet concentration increases, the removal efficiency and absorption rate of NO decreases because of the competing role of SO2 in consuming produced OH radicals or the direct oxidation with H2O2. This effect becomes more intense at higher SO2 concentrations. In fact, at the presence of SO2 the more electrical power is required to produce enough OH radicals and limit the competitive effect as much as possible.
3.4. Effect of NO Inlet Concentration on Its Removal Efficiency and EEC ValuesAccording to the data shown in Table 1, the NO absorption rate increases from 1.44 × 10⁻⁴ to 2.84 × 10⁻⁴ when NO concentration increases from 200 to 500 ppm. The absorption rate enhances because NO partial pressure in gas phase increases. This leads to an increase in NO mass transfer driving force and promotes the absorption rate of this gas. However, as can be seen from Fig. 5, the removal efficiency decreases from 65% to approximately 51%. Fig. 5 also depicts that the electrical energy increases with NO inlet concentration and reach 4 × 10⁻² kWh/m3. Because of the low solubility of NO in aqueous H2O2 solution, its absorption is affected by its solubility in liquid phase. The NO solubility parameter is nearly 1.82 × 10⁻⁸ mol/L. Pa in water [3]. The NO outlet concentration becomes higher when its inlet concentration increases. Similar results were reported by other researchers such as Liu et al. [11] and Liu et al. [24]. This has negative effect on removal efficiency and EEC.
3.5. Effect of Solution pH on NO Removal EfficiencyTo investigate the effect of pH of oxidation medium on NO removal efficiency, some experiments were performed by preparing H2O2 solutions with different pH by adding NaOH solution (0.5 M). As Fig. 6(a) shows, an increase in solution pH from 3.2 (2 molar H2O2) to about 6, leads to a significant decrease in removal efficiency. However, with an increase in pH from 7 to 10, removal efficiency reaches to 91%. The effect of oxidation solution pH can be explained from two perspectives. First, an increase in solution pH intensify H2O2 hydrolysis reaction and produce the ·OH free radical scavenger species such as HO2− consuming OH free radicals and H2O2 and therefore reducing NO removal efficiency [20, 22, 23]. The related reactions are as follows. Furthermore, according to Eq. (23), under this condition H2O2 may decompose to water and oxygen rather than hydroxyl radical. Therefore, the lower removal percentage in this pH range is due to reduction of hydroxyl radical concentration [23].
3.6. Comparison between Different Oxidation-reaction MediumsIn order to compare the effect of oxidation solution on removal efficiency, some experiments were conducted by adding NaOH (0.5 M solution) into the H2O2 solution. The experimental results shown as a histogram in Fig. 6(b), are related to different oxidation mediums. The removal efficiency of NO in pure water solution is about 2% (not shown in Fig. 6) due to the very low solubility of NO in water. However, the removal efficiency reached about 10%, in reaction medium including H2O and UV light, which can contribute to the effect of UV source. Although, using H2O2 or H2O2/NaOH (pH = 10) without UV light can enhance NO removal efficiency in comparison with H2O, but the presence of UV source significantly promotes NO absorption process. The NO removal efficiency is approximately 90% for UV/H2O2/NaOH (0.5 M) reaction system at pH = 10.
The results presented in Fig. 6(b) are used to calculate the values of ɛ1 and ɛ2. The values of 1.2 and 1.8 are obtained for H2O2/UV and H2O2/NaOH(0.5 M)/UV (pH = 10), respectively. The additive factors are lower than that of obtained by Liu et al. [37] because the lower power of UV lamp used in this study. However, these values confirm the positive effect of applying UV light source in enhancing the performance of oxidant solutions in an AOP process for simultaneous removal of NO and SO2. The H2O2 photolysis under UV irradiation and producing OH radicals with strong oxidation ability in comparison with H2O2 results in more NO absorption capacity for H2O2 solution. Because of the positive effect of NaOH (at pH = 10) on NO absorption, the cooperative factor between UV lamp and H2O2 solution enhances in the presence of NaOH. The results are in consistency with that of obtained in section 3.5 for pH of oxidation medium. By adding NaOH into H2O2 solution and adjusting pH of solution into 10, the NO removal efficiency improved.
4. ConclusionsThe performance of a UV/H2O2 AOP in removing gases pollutant, including NO and SO2, was experimentally investigated to relate EEC values to NO removal efficiency. The variations in NO removal efficiencies in different NO, SO2 and H2O2 inlet concentrations are analyzed and EEC term was obtained. The results indicated that the presence of SO2 has negative effect on NO removal efficiency and EEC values. An increase in NO inlet concentration and gas flow rate decreased NO removal percentage. However, EEC values increased. The result of experiments which performed to investigate the effect of oxidation medium pH, also revealed that pH had different positive and negative effects depending on its value. Adding NaOH into oxidation medium caused an increase in removal efficiency.
AcknowledgmentsThe authors thank the Iran National Science Foundation (INSF) and Iran Chemical Industries Investment Company (ICIIC, LAB) for financial assistance of this work.
References1. Hao R, Zhang Y, Wang Z, et al. An advanced wet method for simultaneous removal of SO2 and NO from coal-fired flue gas by utilizing a complex absorbent. Chem Eng J. 2017;307:562–571.
2. Hao R, Zhao Y, Yuan B, Zhou S, Yang S. Establishment of a novel advanced oxidation process for economical and effective removal of SO2 and NO. J Hazard Mater. 2016;318:224–232.
3. Liu Y, Pan J, Tang A, Wang Q. A study on mass transfer-reaction kinetics of NO absorption by using UV/H2O2/NaOH process. Fuel. 2013;108:254–260.
4. Liu Y, Zhang J. Photochemical oxidation removal of NO and SO2 from simulated flue gas of coal-fired power plants by wet scrubbing using UV/H2O2 advanced oxidation process. Ind Eng Chem Res. 2011;50:3836–3841.
5. Zhao Y, Hao R, Zhang P, Zhou S. Integrative process for simultaneous removal of SO2 and NO utilizing a vaporized H2O2/Na2S2O8
. Energ Fuel. 2014;28:6502–6510.
6. Owusu SO, Adewuyi YG. Sonochemical removal of nitric oxide from flue gases. Ind Eng Chem Res. 2006;45:4475–4485.
7. Adewuyi YG, Sakyi NY. Simultaneous absorption and oxidation of nitric oxide and sulfur dioxide by aqueous solutions of sodium persulfate activated by temperature. Ind Eng Chem Res. 2013;52:11702–11711.
8. Hutson ND, Krzyzynska R, Srivastava RK. Simultaneous removal of SO2, NOx, and Hg from coal flue gas using a NaClO2-enhanced wet scrubber. Ind Eng Chem Res. 2008;47:5825–5831.
9. Khan NE, Adewuyi YG. Absorption and oxidation of nitric oxide (NO) by aqueous solutions of sodium persulfate in a bubble column reactor. Ind Eng Chem Res. 2010;49:8749–8760.
10. Liu Y, Zhang J, Pan J, Tang A. Investigation on the removal of NO from SO2-containing simulated flue gas by an ultraviolet/Fenton-like reaction. Energ Fuel. 2012;26:5430–5436.
11. Liu Y, Zhang J, Sheng C, Zhang Y, Zhao L. Wet removal of sulfur dioxide and nitric oxide from simulated coal-fired flue gas by UV/H2O2 advanced oxidation process. Energ Fuel. 2010;24:4931–4936.
12. Liu Y, Zhang J, Sheng C, Zhang Y, Zhao L. Preliminary study on a new technique for wet removal of nitric oxide from simulated flue gas with an ultraviolet (UV)/H2O2 process. Energ Fuel. 2010;24:4925–4930.
13. Adewuyi YG, Owusu SO. Aqueous absorption and oxidation of nitric oxide with oxone for the treatment of tail gases: Process feasibility, stoichiometry, reaction pathways, and absorption rate. Ind Eng Chem Res. 2003;42:4084–4100.
14. Adewuyi YG, Sakyi NY, Khan MA. Simultaneous removal of NO and SO2 from flue gas by combined heat and Fe2+ activated aqueous persulfate solutions. Chemosphere. 2018;193:1216–1225.
15. Kasper M, Clausen JA, Cooper CD. Control of nitrogen oxide emissions by hydrogen peroxide-enhanced gas-phase oxidation of nitric oxide. J Air Waste Manage Assoc. 1996;46:127–133.
16. Chien TW, Chu H. Removal of SO2 and NO from flue gas by wet scrubbing using an aqueous NaClO2 solution. J Hazard Mater. 2000;80:43–57.
17. Deshwal BR, Lee HK. Mass transfer in the absorption of SO2 and NOx using aqueous euchlorine scrubbing solution. J Environ Sci. 2009;21:155–161.
18. Haywood JM, Cooper CD. The economic feasibility of using hydrogen peroxide for the enhanced oxidation and removal of nitrogen oxides from coal-fired power plant flue gases. J Air Waste Manag Assoc. 1998;48:238–246.
19. Chu H, Chien TW, Li SY. Simultaneous absorption of SO2 and NO from flue gas with KMnO4/NaOH solutions. Sci Total Environ. 2001;275:127–135.
20. Liu Y, Wang Q, Yin Y, Pan J, Zhang J. Advanced oxidation removal of NO and SO2 from flue gas by using ultraviolet/H2O2/NaOH process. Chem Eng Res Design. 2014;92:1907–1914.
21. Liu Y, Zhang J, Wang Z. A study on kinetics of NO absorption from flue gas by using UV/Fenton wet scrubbing. Chem Eng J. 2012;197:468–474.
22. Muruganandham M, Swaminathan M. Photochemical oxidation of reactive azo dye with UV-H2O2 process. Dyes Pigm. 2004;62:269–275.
23. Modirshahla N, Behnajady MA. Photooxidative degradation of Malachite Green (MG) by UV/H2O2: Influence of operational parameters and kinetic modeling. Dyes Pigm. 2006;70:54–59.
24. Liu Y, Wang Q, Pan J. Novel process of simultaneous removal of nitric oxide and sulfur dioxide using a vacuum ultraviolet (VUV)-activated O2/H2O/H2O2 system in a wet VUV – Spraying reactor. Environ Sci Technol. 2016;50:12966–12975.
25. Liu Y, Pan J, Wang Q. Removal of Hg0 from containing-SO2/NO flue gas by ultraviolet/H2O2 process in a novel photochemical reactor. AIChE J. 2014;60:2275–2285.
26. Liu Y, Liu Z, Wang Y, et al. Simultaneous absorption of SO2 and NO from flue gas using ultrasound/Fe2+/heat coactivated persulfate system. J Hazard Mater. 2018;342:326–334.
27. Liu Y, Wang Y, Wang Q, Pan J, Zhang J. Simultaneous removal of NO and SO2 using vacuum ultraviolet light (VUV)/heat/peroxymonosulfate (PMS). Chemosphere. 2018;190:431–441.
28. Liu Y, Xu W, Zhao L, Wang Y, Zhang J. Absorption of NO and simultaneous absorption of SO2/NO using a vacuum ultraviolet light/ultrasound/KHSO5 system. Energ Fuel. 2017;31:12364–12375.
29. Liu Y, Zhang J, Sheng C. Kinetic model of NO removal from SO2-containing simulated flue gas by wet UV/H2O2 advanced oxidation process. Chem Eng J. 2011;168:183–189.
30. Zhao Y, Wen X, Guo T, Zhou J. Desulfurization and denitrogenation from flue gas using Fenton reagent. Fuel Process Technol. 2014;128:54–60.
31. Liu Y, Zhang J, Pan J. Photochemical oxidation removal of Hg0 from flue gas containing SO2/NO by an ultraviolet irradiation/hydrogen peroxide (UV/H2O2) process. Energ Fuel. 2014;28:2135–2143.
32. Moheb Shahrestani M, Rahimi A, Momeni M. Experimental study and mathematical modeling of NO removal using the UV/H2O2 advanced oxidation process. Chem Eng Technol. 2017;40:1149–1157.
33. Mahamuni NN, Adewuyi YG. Advanced oxidation processes (AOPs) involving ultrasound for waste water treatment: A review with emphasis on cost estimation. Ultrason Sonochem. 2010;17:990–1003.
34. Crittenden JC, Hu S, Hand DW, Green SA. A kinetic model for H2O2/UV process in a completely mixed batch reactor. Water Res. 1999;33:2315–2328.
35. Adewuyi YG, He X, Shaw H, Lolertpihop W. Simultaneous absorption and oxidation of NO and SO2 by aqueous solutions of sodium chlorite. Chem Eng Commun. 1999;174:21–51.
Fig. 1Schematic of the experimental setup, 1–3: Gas cylinders, 4–6: Mass flow controllers, 7: Mixing manifold, 8: Bubble reactor, 9: Bubble maker, 10: UV lamp, 11: Liquid inlet, 12: Liquid discharge, 13–15: valves, 16: Gas analyzer. 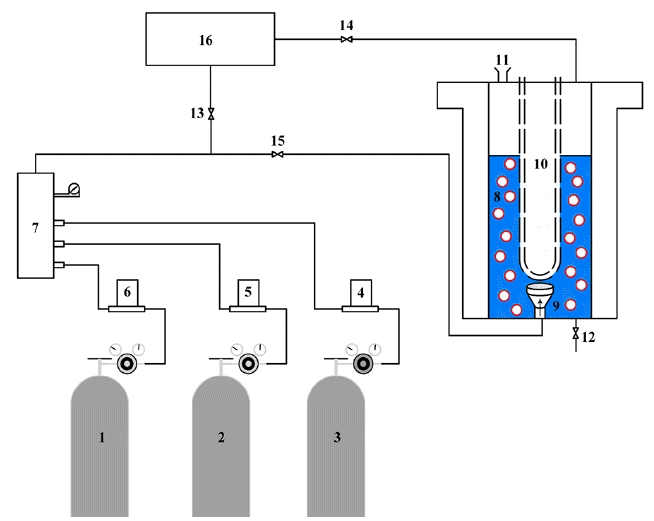
Fig. 2Effect of H2O2 initial concentration on NO final removal efficiency and EEC value, NO inlet concentration: 300 ppm, SO2 inlet concentration = 800 ppm, total gas flow rate: 650 mL/min. 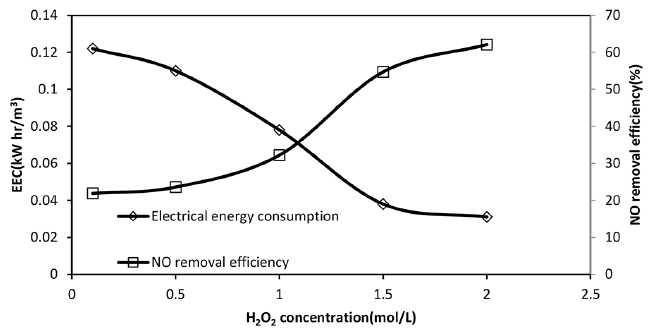
Fig. 3Effect of total gas flow rate on NO removal efficiency and EEC value, NO inlet concentration: 300 ppm, SO2 inlet concentration = 800 ppm, H2O2 initial concentration = 2 mol/L. 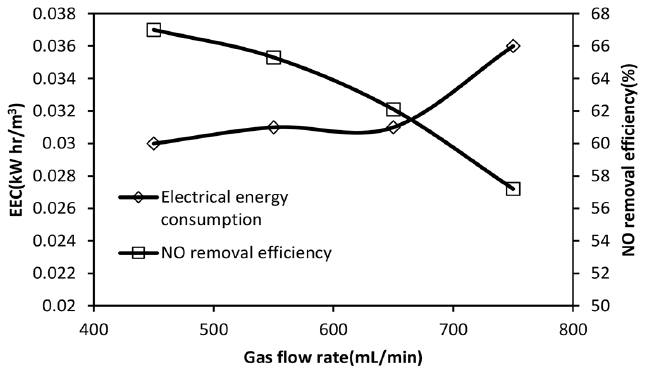
Fig. 4Effect of SO2 inlet concentration on NO final removal efficiency and EEC value, NO inlet concentration: 300 ppm, H2O2 initial concentration = 2 mol/L, total gas flow rate = 650 mL/min. 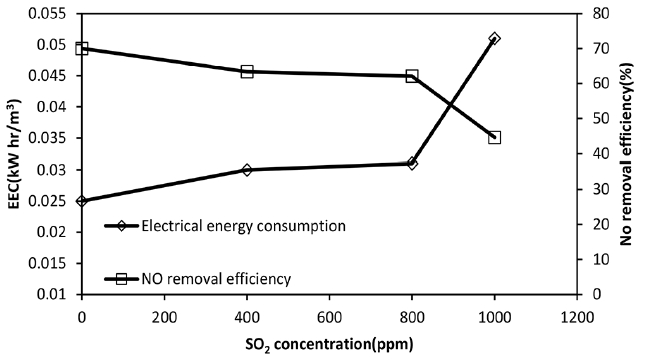
Fig. 5Effect of NO initial concentration on NO removal efficiency and EEC value, H2O2 initial concentration = 2 mol/L, total gas flow rate = 650 mL/min, SO2 inlet concentration = 800 ppm. 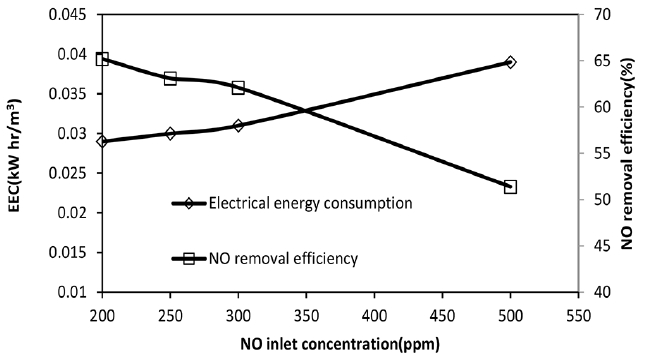
Fig. 6(a) Effect of solution pH on NO removal efficiency, (b) Comparison between different reaction medium in NO removal efficiency. 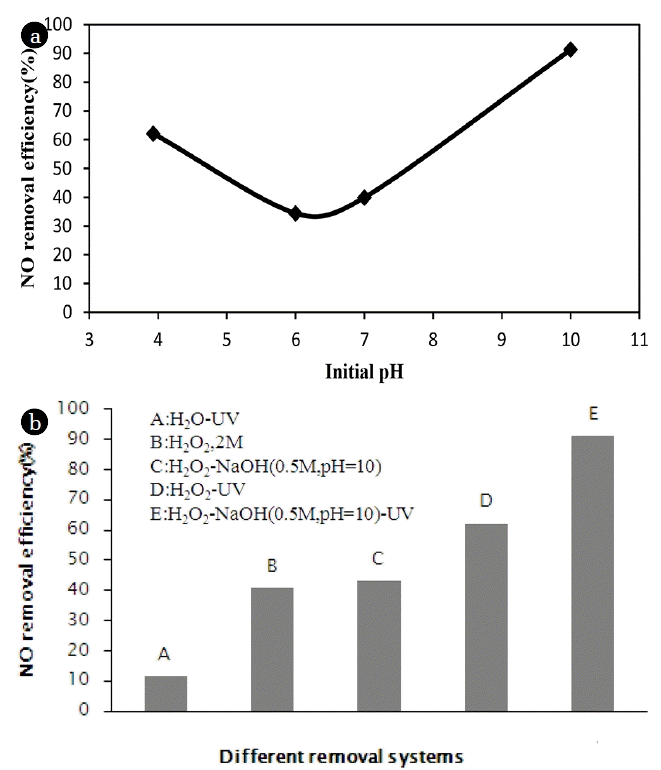
Table 1The Experimental Results for NO Absorption Rate at Different Conditions
It should be mentioned that experiments were conducted at SO2 initial concentration = 800 ppm, NO initial Concentration = 300 ppm, Qg = 650 mL/min, and H2O2 = 2 M, expect for cases where a parameter was changed based on first column. RNO was calculated based on experimental data, ηNO is NO removal efficiency, CNO, in in is NO inlet concentration (ppmv), Qg is gas flow rate (mL/min), vL is liquid volume (mL) [1]. The constant value in denominator is used for dimensional consistency. Table 2The Volumetric Mass Transfer Coefficients and Parameters Used for E.E.C. Calculation
|
|
||||||||||||||||||||||||||||||||||||||||||||||||||||||||||||||||||||||||||||||||||||||||||||||||||||||||||||||||||||||