1. Introduction
Reverse osmosis (RO) membrane-based technologies are now widely being used for producing potable and ultra-pure water from wastewater, seawater, and surface water rather than using conventional water treatment processes because the energy consumption of the RO process is much lower and the operational safety is higher [1–4].
However, fouling is inevitable in RO processes, which causes a flux reduction, high energy demand, and increases membrane damage and the need for replacement. As such, the productivity and lifetime of RO membranes are severely limited by the fouling [5–7]. For this reason, periodic membrane cleaning is an integral part of the successful operation of RO processes. There are two general methods for the removal of foulants: physical cleaning and chemical cleaning. Physical cleaning includes backflushing, vibration, air sparging, automatic sponge ball cleaning, and ultra-sonication [8]. Foulants can also be efficiently eliminated using various chemical cleaning agents [9–10], though the cleaning efficiency is strongly influenced by parameters such as temperature, cleaning agent concentration, operating pressure, flowrate, and cleaning time [11].
The operational cost of RO processes can increase due to excessive and frequent membrane chemical cleaning, with membrane cleaning generally accounting for 50% of the total operation costs of seawater desalination plants. Frequent membrane chemical cleaning can also shorten the membrane lifetime [12]; hence, optimized protocols for membrane chemical cleaning must be employed to overcome the drawbacks of RO membrane operation [13].
A full factorial design (FFD) allows multiple factors to be investigated at the same time and enables the more accurate identification of interactions between factors. A central composite design (CCD) is an alternative model for determining the curvature in quadratic terms. Hence, a design of experiments (DOE) concepts, which is one of response surface methods that seek the relationships between several descriptive variables and response variables, was employed in the study of RO membrane cleaning in order to reduce the number of experimental runs required for determining the effect of changing one factor and thereby optimizing conditions by balancing tradeoffs. Shams et al. [14] revealed that FFD and CCD can be used to find the optimal conditions for the filtrate production of a single 8-inch commercial ultrafiltration membrane with regards to feed pressure, backwash pressure, forward filtration time, and backwash time. In addition, Yi et al. [15] revealed that FFD can be employed to screen significant factors affecting the flux decline of anionic polyacrylamide in ultrafiltration processes. Chen et al. [16] conducted experiments to accurately identify key factors and their interactions in physical and chemical cleanings based on a statistical factorial design.
Sodium alginate was selected as the model foulant to simulate organic fouling on the surface of RO membranes in the presence of Ca2+ ions [17–19]. Using the factorial design method, the subsets of key factors identified and interactions that impacted the flux recovery and cleaning efficiency were sequentially used in the CCD to model the response variables with curvature, and a response surface designed experiment was then used to determine the optimal setting for each factor during RO membrane cleaning. The objective of this study was to suggest a methodology for selecting an optimal combination of cleaning agents and chemical/physical conditions for efficient cleaning, using DOE as a statistical design tool. Overall, four key chemical/physical factors impacting the RO membrane cleaning efficiency, as reported in Ang et al. [20] and Garcia-Fayos et al. [11], were selected for use in evaluating multiple factors set at various levels: cleaning agent type, chemical concentration, cleaning time, flowrate, and cleaning temperature.
Due to the variety of cleaning protocols of commercial membranes by manufacturers, optimal conditions of membrane cleaning is difficult to be defined. To figure out the optimal conditions on various membranes, the experiments on membranes for the fouling and cleaning should be accomplished. Hence many researchers have been studying to find out the optimal conditions by an experiment [11, 20]. However, too many variables must be considered to increase the accuracy of the optimal conditions, then, the experiment stage becomes so complicated. So, this research suggests the procedure for finding the optimal condition of reverse osmosis membrane cleaning using DOE method to simplify the experimental stage.
Therefore, this paper discusses differences in the chemical cleaning efficiency between statistically determined optimal chemical cleaning factors obtained by FFD and CCD composite and chemical cleaning factors obtained from membrane manufacturer guidelines. We then confirm whether the DOE method can effectively predict the operational factors for chemical cleaning.
2. Experimental Methods
2.1. RO Membrane
A thin-film polyamide brackish water RO (BWRO) membrane, RE8040-BLR (Toray Chemical Korea, Inc., Korea), was used in this study. The permeate flow rate was determined to be 38.08 L/m2·h (LMH) and stabilized salt rejection was 99.6% under the following standard manufacturer-recommended test conditions: NaCl solution of 1,500 mg/L, pressure of 150 psi (10.34 bar) and temperature of 25°C. BWRO membranes were stored in deionized (DI) water at 4°C prior to each experiment.
2.2. Organic Fouling Matter
Sodium alginate (Sigma-Aldrich, USA), extracted from brown algae, was used as the organic foulant. An organic foulant solution (1 g/L) was prepared by dissolving sodium alginate in DI water and adding 1 mM CaCl2·2H2O (OCI Company Ltd., Korea) as divalent cations to aggressively form an organic fouling layer on the RO membranes. Sodium alginate was stirred for over 24 h to completely dissolve the foulant.
2.3. Cleaning Chemical Agents
Sodium hydroxide (NaOH) from OCI Company Ltd. (Korea), citric acid, sodium dodecyl sulfate (SDS), and ethylenediaminetetraacetic acid (EDTA) from Sigma-Aldrich (USA) were used as the chemical cleaning agents.
2.4. Dead-end RO System and Operating Conditions
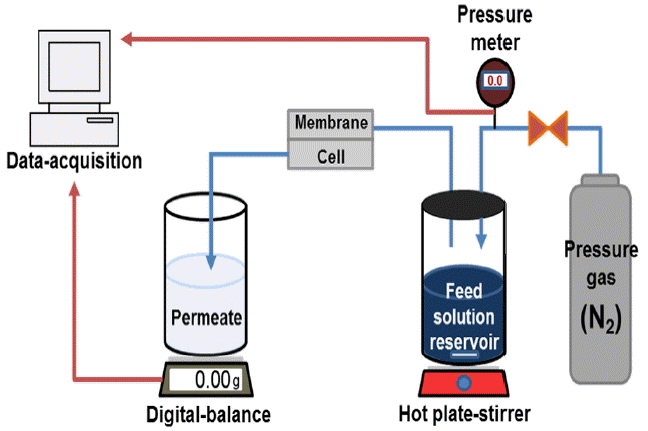
A lab-scale dead-end filtration system was used to investigate the efficiency of static cleaning for each of the chemical cleaning agents (i.e., NaOH, SDS, EDTA, and citric acid). Prior to cleaning test, dense layer of organic fouling was made by dead-end filtration. In Fig. 1, this filtration system is seen to be comprised of pressure gas, a feed solution reservoir and stirred hot plate, a permeate tank with digital balance, a membrane cell, a pressure meter, and a data-acquisition computer. The water flux (Jw; LMH) was measured using a digital balance (GF-6100, A&D, USA) and was automatically recorded on a computer. The operating conditions of the dead-end filtration are summarized in Table 1.
2.5. Cross-flow RO System and Operating Conditions
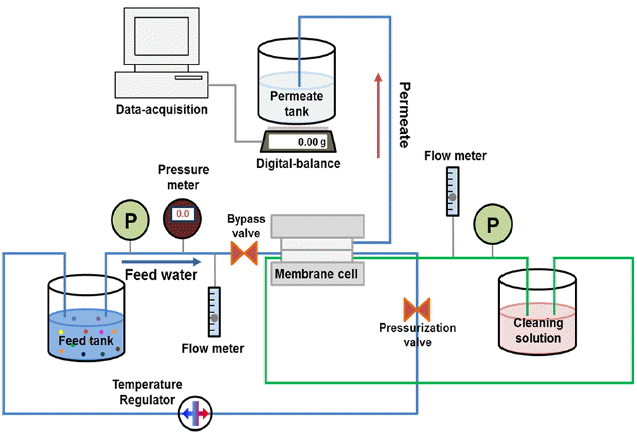
To determine the optimum membrane cleaning conditions, a lab-scale RO system in cross-flow mode was applied. In Fig. 2, the feed and cleaning solutions were circulated using gear pumps (Micropump, Cole-Parmer, USA). The hydraulic pressure and flowrate were adjusted using a bypass and pressurization valves. The permeate volume was measured using a digital balance, and the water flux was calculated using a data-acquisition computer. The operating conditions of this system are summarized in Table 2.
2.6. Experimental Design Using FFD
FFD has been used to accurately identify interactions between factors and to determine the effects of one factor from several levels; it can reduce the number of experiments required to determine the effects derived from the one factor change [16]. The FFD analyzes the influence of every factor at low (-1), center (0), and high (+1) levels. The specific experimental parameters are shown in Table 3. In terms of cleaning solution, only EDTA was used, according to the experimental results of static cleaning.
Detailed levels at low, center and high levels were determined based on membrane manufacturer guidelines. The curvature effect was investigated while the center point (Ct-Pt) was added to the FFD. Experimental designs of FFD are presented in Table 4. Factorial plots were obtained to reveal the influence of each significant factor, interaction between factors, and curvature effect. Minitab 17 (Minitab Inc., USA) was used for the factorial design analysis.
2.7. Experimental Design Using CCD
CCD was employed to elucidate the curvature effect from the factorial design and establish the quadratic polynomial model. The central point (0) and axial point (α) are added to the FFD. Experimental conditions in the CCD analysis are summarized in Table 5. Eq. (1) of the quadratic polynomial model was obtained using Minitab 17 (Minitab Inc., USA) [21]:
where Yu is the predicted response, β0 is the constant coefficient, x1u and x2u are the linear effect coefficients, x1u2 and x2u2 are the quadratic effect coefficients, x1u x2u is the interaction effect coefficient, and eu is an unobserved random error.
2.8. Organic Fouling and Cleaning Experiments
2.8.1. RO dead-end filtration and static cleaning tests
To determine the cleaning efficiencies of the chemical cleaning agents (i.e., NaOH, SDS, EDTA, and citric acid) on s densely formed organic fouling layer using static cleaning, the organic fouling and membrane cleaning procedures in a dead-end filtration system are as follows: 1) filtrate with DI water (membrane conditioning) for 15 min; 2) measure the initial water flux using DI water for 15 min; 3) filtrate with 1 L of 1 g/L sodium alginate containing 1 mM CaCl2, then, it can gain the 80 mL of permeate water; 4) perform static cleaning with each chemical agent at 30°C for 1 h; 5) measure the water flux after static cleaning for 15 min, and 6) calculate the cleaning efficiency using Eq. (2).
where Jwi is the initial water flux, and Jwc is the water flux after membrane cleaning.
2.8.2. RO cross-flow filtration and dynamic cleaning test
To find the optimum chemical cleaning efficiency of EDTA on the dense organic fouling layer in cross-flow mode, the steps used to form the dense fouling layer and the membrane cleaning procedure are as follows: 1) filtrate with DI water for 120 min for membrane compaction, 2) measure the initial water flux using DI water for 30 min, 3) filtrate with 1 L of 1 g/L sodium alginate containing 1 mM CaCl2, then, it can gain the 75 mL of permeate water, 4) perform cross-flow cleaning with EDTA solution using DOE experimental conditions, 5) measure the water flux after cleaning for 15 min, and 6) calculate the cleaning efficiency using Eq. (2).
3. Results and Discussion
3.1. Static Cleaning Test; Normalized Water Flux (Jw/J0) and Flux Recovery Ratio (FRR)
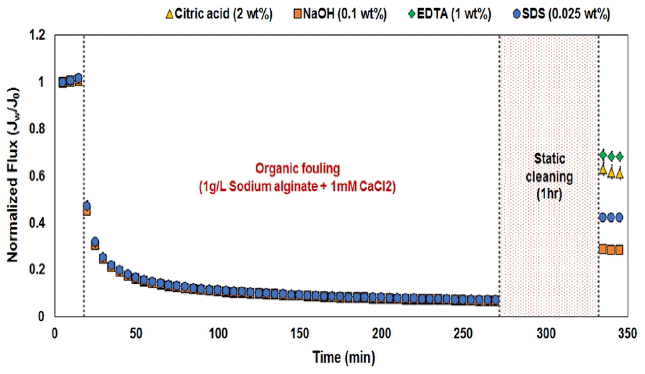
In this study, four different classes of cleaning agents were used to clean the organic-fouled RO membrane, including: acid solution (citric acid), alkaline solution (NaOH), metal chelating agent (EDTA), and surfactant (SDS). To clean the organic-fouled membranes, acid solutions were used to dissolve metallic oxides and hydroxides and carbonates, whereas alkaline solutions are applied to remove organic matter by hydrolysis and solubilization. Metal chelating agents remove divalent cations from the complexed organic molecules. Surfactants that have both hydrophilic and hydrophobic groups can solubilize macromolecules by forming micelles around them and help to improve the cleaning efficiency of the fouled membrane.
Prior to optimizing the chemical cleaning conditions by using DOE, static chemical cleaning tests were conducted in order to select which chemical agent is most suitable to remove organic fouling formed through the operation of an RO dead-end filtration system, reducing the overall number of experimental sets and runs. Fig. 3 shows the changes in water flux when the RO filtration was operated to form organic fouling on the membrane surface, static chemical cleaning using four different agents for 1 h, and recovery of the water flux. From the FRR (%) of each chemical agent (NaOH, citric acid, SDS, and EDTA), 1 wt% of EDTA displayed the best cleaning efficiency of 69.04% (±2.4) compared to the other cleaning agents. From a previous study [17–19], the efficiency of chemical cleaning depends on whether the chemical agent can break down the bonding between alginate and Ca2+ when Ca2+ exists in the organic fouling layer. By the same token, EDTA, a metal chelating agent, can be combined with divalent cations such as Ca2+, to break down the bonds between alginate and Ca2+ [12]. Therefore, EDTA was chosen as chemical agent to clean the fouled-RO membrane, and DOE was then used to optimize the cleaning parameters in this study.
3.2. FFD in RO Cross-flow Filtration System
A multi-factor experiment (FFD) using DOE was carried out at three levels per factor, for every possible combination of the other factors and their levels using four chemical/physical cleaning factors on cleaning agent type: chemical concentration, cleaning time, flowrate, and cleaning temperature (Table 4). By defining the factors and levels, full factorial experiments that study all paired interactions can be economic and practical to reduce the number of experimental runs.
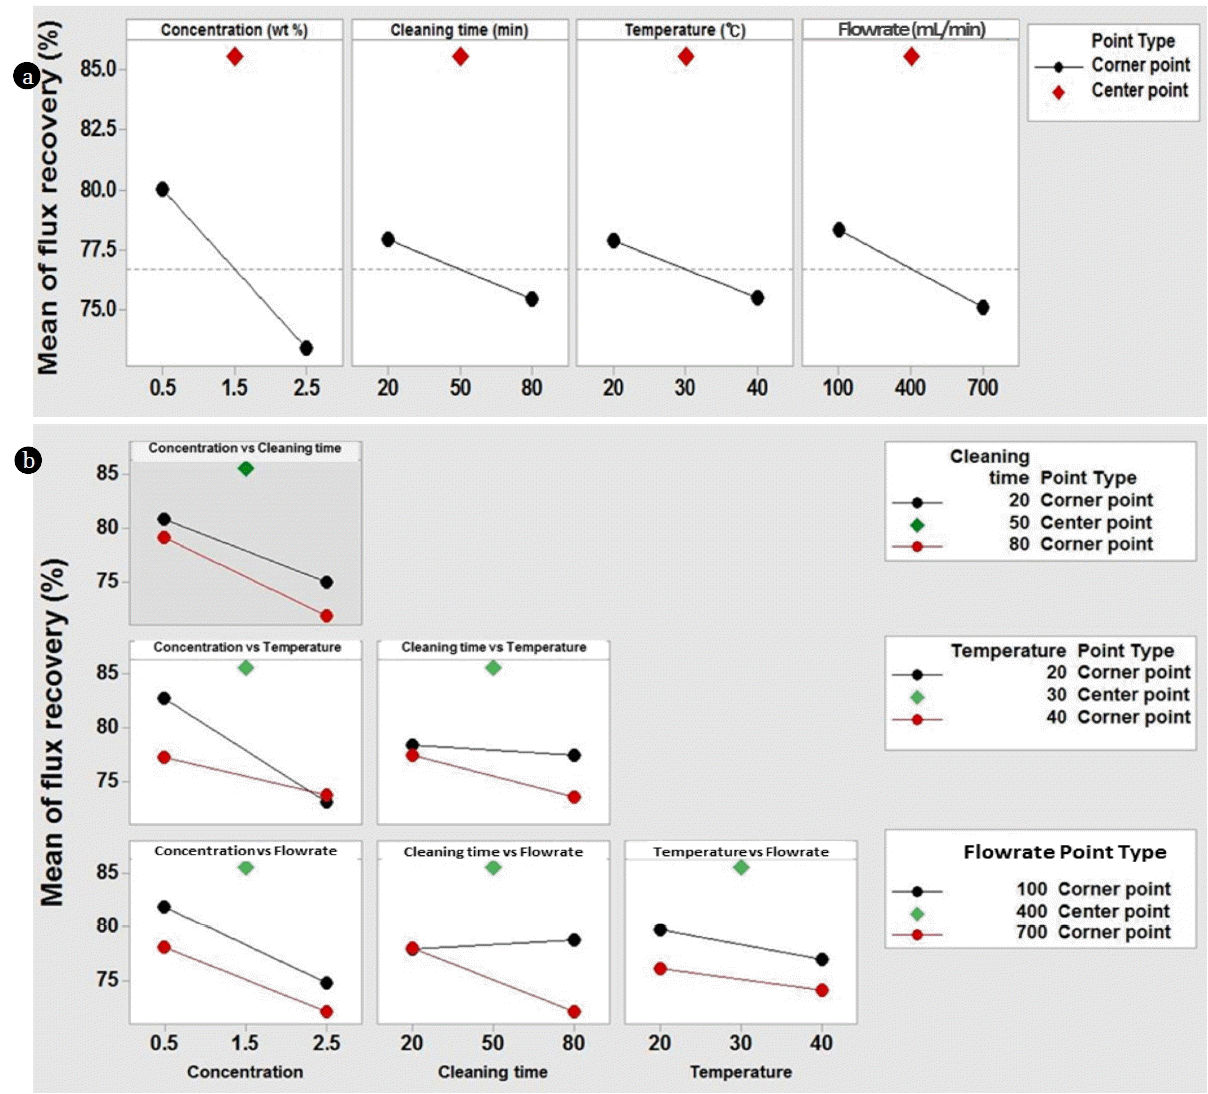
Fig. 4 illustrates the significant impact of each factor, their interaction, and center point with regards to water flux recovery and cleaning efficiency. All independent factors show a negative slope, which means that the flux recovery at a low-level is higher than at a high-level. In other words, low-level conditions for all factors have an advantage in restoring the water flux. In particular, the chemical agent concentration is seen to be one of the most important variables, showing the largest slope of the factors. A regression analysis was then carried out to quantitatively identify the factors affecting the flux recovery; a p-value of more than 0.1 was treated as the error-term, and a stepwise method was used. Overall, eight factors including combinations of concentration, cleaning time, temperature, and flowrate affecting the flux recovery are summarized in Table 6. From the table, the equation model created by factorial design is deemed unsuitable for determining the optimum chemical cleaning conditions. Furthermore, the center points of all factors are much higher than the linear line between the low and high levels. Since a curvature effect was detected in the FFD, CCD was subsequently performed to model a response variable having curvature.
3.3. CCD in RO Crossflow Filtration System
3.3.1. Regression model equation and analysis by CCD
CCD was used to efficiently estimate the first- and second-order terms and to establish a model equation by adding center and axial points to previously-performed factorial experiments (Table 5). The experimental results and the predicted FRR of cleaning by CCD are shown in Table 7. The following regression equation in coded units was established using statistical software (Minitab 17, Minitab Inc., USA) to explain the efficiency of chemical cleaning.
where YFRR, as a dependent variable, is the predicted FRR by chemical cleaning, and independent variables are the concentration of EDTA (A), cleaning time (B), temperature (C), and flowrate (D). To evaluate the suitability of the regression equation of FRR, Eq. (3) was verified using a coefficient of determination (R2), a value representing whether a regression model fits the experimental data. In addition, an adjusted coefficient of determination (adj-R2) was used to verify the suitability of the model, since the value of R2 tends to increase when independent variables are added to the model. The values of R2 and adj-R2 at a 90% confidence level were 83.95% and 76.82%, respectively. Therefore, the values predicted using the equation present a relatively high correlation with the experimental data.
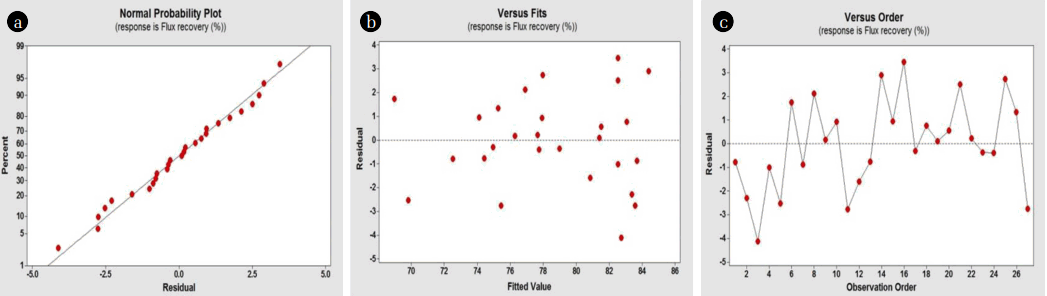
3.3.2. Residual analysis of CCD regression model equation
A residual analysis, which is the difference between experimental and predicted responses, was performed to verify the model adequacy. Fig. 5 presents the residual plots for error values in CCD. Model adequacy must have the following conditions: 1) the residual should conform to a normal distribution; 2) homoscedasticity, i.e., the residual should be randomly scattered on a center of 0, with no outliers existing on the residual versus fit plot; and 3) independence and stability, which dictate that the relation between the residual and observation order should not be a regular pattern.
Fig. 5(a) illustrates whether the probability plot of the residual follows a normal distribution. Here, the residual was deemed normal since it was linearly distributed between −5 and +5. In addition, the residual and predicted response are randomly scattered within ±4 (Fig. 5(b)); thus, homoscedasticity was identified. Fig. 5(c) shows that the residual is irregularly distributed, regardless of the experimental order, i.e., the residual is unaffected by data order. From these results, the regression model equation of the CCD was determined such that all elements (normality, homoscedasticity, independence, and stability) of the residual were satisfied, and was sufficiently confirmed to explain the CCD.
3.3.3. Contour plot and response surface plot of CCD
After running a factorial experiment to determine the significant factors, a response surface methodology was applied to determine the optimal conditions for chemical cleaning, using a 2D-contour plot and a 3D-response surface plot. The two plots graphically display the effects of the independent variables and their relationships (dependent variables). In Fig. 6(a), the 2D-contour plots show the impact on flux recovery between independent variables; the range of optimum chemical cleaning conditions for the flux recovery was more than 86%. From these results, the EDTA concentration range was 0.5 mg/L to 1.1 mg/L, the cleaning time was 20 min to 35 min, the temperature was 20°C to 22°C, and the flowrate was 300 mL/min to 500 mL/min.
In Fig. 6(b), the 3D-response surface plot highlights the potential relationships and curvature effects between the two independent variables and dependent variable (response). As such, the 3D-response surface plot can determine the maximum response, which is the curvature spot of each independent variable. Through 3D-response surface plot, the regression model equation of the chemical cleaning effect is seen to have a stationary point, and a point of maximum response confirms its existence in the region of exploration of the independent variable. From the 3D-response surface plots, the curvature spot of the EDTA concentration was roughly between 0.5 mg/L and 0.8 mg/L, the cleaning time was close to 20 min, the temperature was 20°C, and the flowrate was 400 mL/min.
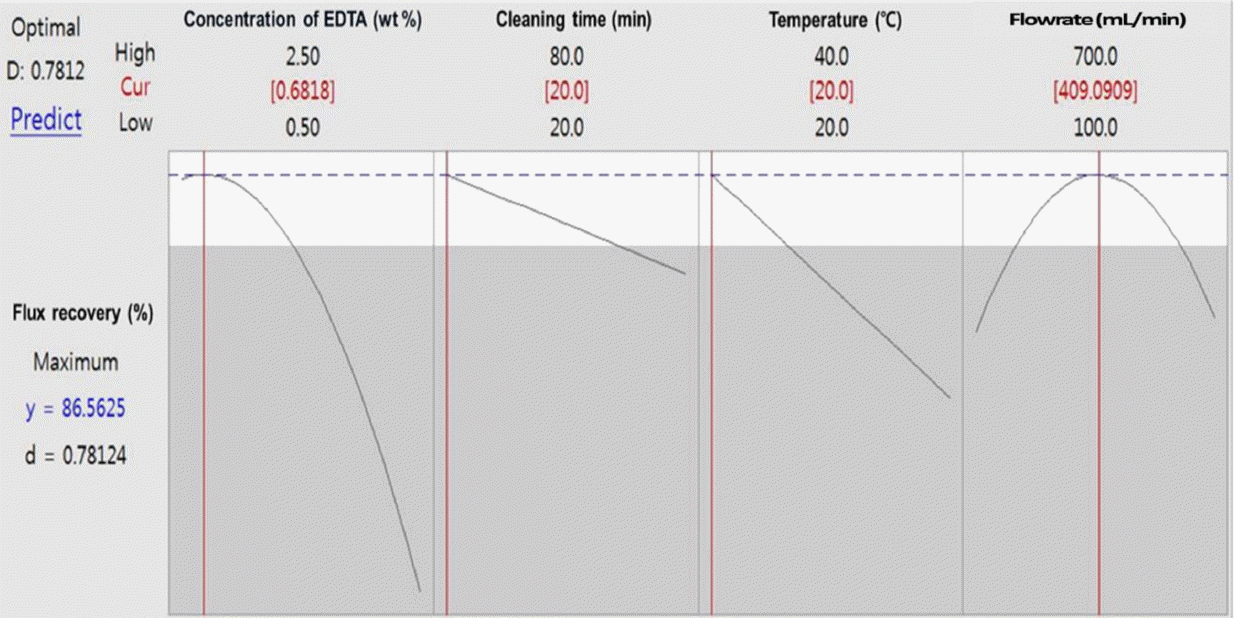
3.3.4. Optimization condition for chemical cleaning of organic fouling
Contour plots could be used to determine the area for the optimization of independent variables; however, they could not obtain correct values for the optimal conditions for chemical cleaning. Consequently, in Fig. 7, the response optimizer tool of Minitab 17 (Minitab Inc., USA) was used to find the values for optimal conditions. As results, in a range of 85–87% flux recovery, the optimal conditions for chemical cleaning are as follows: an EDTA concentration of 0.68 wt%, cleaning time of 20 min, temperature of 20°C, and flowrate of 409 mL/min. Under these conditions, the flux recovery is estimated to be ~86.56%.
3.4. Verification of Modeling
The optimum conditions of chemical cleaning for RO membrane were derived from the model equation using DOE. To verify the predicted conditions and cleaning efficiency from the model equation, comparative experiments were undertaken based on cleaning conditions recommended from the membrane manufacturer guidelines and DOE analysis. These details are summarized in Table 8.
In the Table, there are notable differences between the membrane manufacturer guidelines and results from the DOE analysis, especially with regards to cleaning time and temperature. The optimal cleaning time and temperature obtained using the DOE analysis were only 20 min and 20°C, respectively, as opposed to 60 min and 30°C as suggested by the manufacturer guidelines. The reduction of cleaning time leads to an increase in the permeation time, and eventually induces a flux increase in the membrane. The low temperature could also reduce the energy consumption required for chemical cleaning.
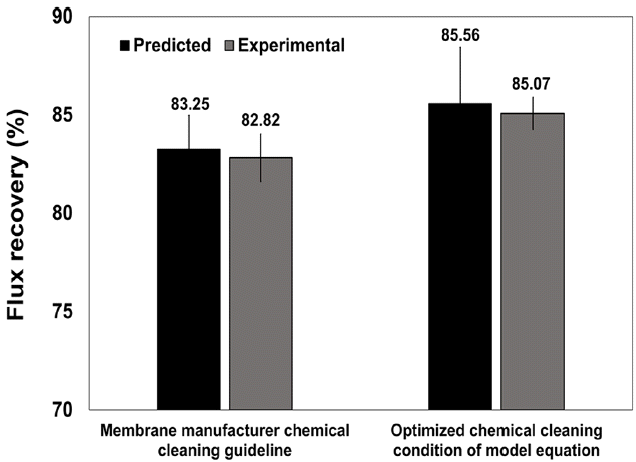
Fig. 8 presents the predicted and experimental results for the membrane guidelines and DOE analysis, which are 83.25% and 85.56%, respectively. Therefore, the cleaning efficiency predicted using conditions from the DOE analysis was 2.31% higher for the membrane manufacturer guidelines. In lab-scale experiments, the cleaning efficiencies were 82.82% and 85.07%, respectively, i.e., the cleaning efficiency predicted by DOE was 2.25% higher than for the membrane manufacturer’s guidelines. Overall, there were minimal differences between the results predicted by DOE and the lab-scale experiments. In addition, it is posited here that the conditions predicted by DOE analysis could be closer to the optimal conditions for chemical cleaning of RO membranes.
Furthermore, the verification of the model equation by lab-scale test indicates that the model equation obtained by DOE is adequate for computationally predicting the cleaning efficiency of RO membranes with regards to organic fouling.
4. Conclusions and Summary
To optimize the cleaning conditions required to control organic fouling on RO membranes, factorial designed experiments using DOE were employed using chemical/physical factors such as cleaning agent type, chemical concentration, cleaning time, flowrate, and cleaning temperature. The resultant regression equation model governing the effect of operational parameters on water flux recovery and cleaning efficiency is as follows: (R2 = 83.9 at a 90% confidence level) Based on this regression model, the optimal conditions for the chemical cleaning of RO membrane are: EDTA concentration of 0.68 wt%, cleaning time of 20 min, temperature of 20°C, and flowrate of 409 mL/min; the flux recovery is then estimated to be ~86.6%.
The predicted and experimental results for chemical cleaning conditions obtained from membrane manufacturer guidelines and the DOE analysis showed that conditions from DOE analysis were closer to being optimum than those provided by the membrane manufacturer. Subsequent verification of the model equation via a lab-scale test confirmed that the model equation obtained by DOE is suitable for predicting the cleaning efficiency of RO membranes with regards to organic fouling. Overall, the framework suggested in this study could also provide a promising way for selecting an optimal combination of cleaning agents and chemical/physical conditions cleaning in other membrane-based filtration systems, which have inevitably suffered from the formation of organic or biofouling on their membrane surface.