1. Introduction
The term ‘heavy metals’ generally refers to such metals as lead (Pb), zinc (Zn), cadmium (Cd), mercury (Hg) and chromium (Cr), or those metallic elements that yield a density greater than 5 g/cm3 [1]. Heavy metal pollution is often associated with variables of concealment, persistency and irreversibility [2]. This pollution not only degrades the quality of the atmosphere, water bodies, and agricultural outputs, but also threatens the health and well-being of both animals and human beings, particularly by way of the food chain [2–4]. At present, the heavy metal pollution of river water has become an urgent problem on the international level [5, 6]. An increasing concentration of metals continues to be found in riverbeds, specifically in those areas inhabited by living species. Due to such processes as biomagnification, higher concentrations of heavy metals are found in the bodies of animals that are closer to the top of the food chain [7].
Assessment indexes of heavy metal pollution included the following variables: single index factor (Pi), Nemerow’s pollution index (PN), [8–9] potential ecological risk index (RI) [5], enrichment factor (EF) [5, 10–13], contamination factor (CF) [6, 14], geoaccumulation index (Igeo) [5, 6, 10, 15], heavy metal evaluation index (HEI), heavy metal pollution index (HPI), contamination index (Cd) [16], pollution load index (PLI) [12]. The arithmetic methods used to calculated both Pi and CF are simply yielded by the computation basis of PN and PLI respectively. EF represents the value that evaluates anthropogenic influences on heavy metals in sediments; the measurement uses aluminum (Al) as a conservative element. RI considers the toxicity of the pollutant as a means of evaluating the ecological risk; the value does so by comparing the concentration of the pollutant with the background value [8]. Igeo can be used to distinguish the effects human activities have on the environment [17]. The afore mentioned indexes RI, EF, and Igeo are used to evaluate sediment or soil. Both the HEI and HPI indexes, in contrast are used to evaluate drinking water. These statistics, however, must modify the threshold value used to assess pollution levels, these indexes are calculated based on measured concentration of samples, values which can not reflect the principal contaminant elements.
The central idea of principal component analysis (PCA) is to reduce the dimensionality of data [18]. PCA can transform raw data into uncorrelated variables representing linear combinations of the raw data [19]. It can identify the heavy metal pollution sources in sediment samples and river water depending on the methods used [5, 10, 20]. Hierarchical cluster analysis (HCA) is a statistical method of analysis allows for data to be grouped into clusters based on observed similarities [21]. HCA was used to detect these similarities and to form groups between the sampling sites [22]. In order to simplify the procedure and reduce the analytical costs of the water quality evaluation, a modified water quality index (WQImin) was introduced based on both PCA and correlation analyses of the water parameters [23].
Because of the fluidity of river water, real-time monitoring for river water quality is one important component of heavy metal pollution investigation. Moving forward, it becomes necessary to propose a rapid detection method. Such a method becomes effective in recognizing principal contaminant elements and real-time water quality during the monitoring of raw data. The objectives of this article are: (1) to identify the sources of six heavy metals contaminations in the Yangping River; (2) to propose the creation and use of real-time monitoring of primary heavy metal elements in the future; (3) to propose a novel assessment method of heavy metals contamination.
2. Materials and Methods
2.1. Study Area and Collection of Water Samples
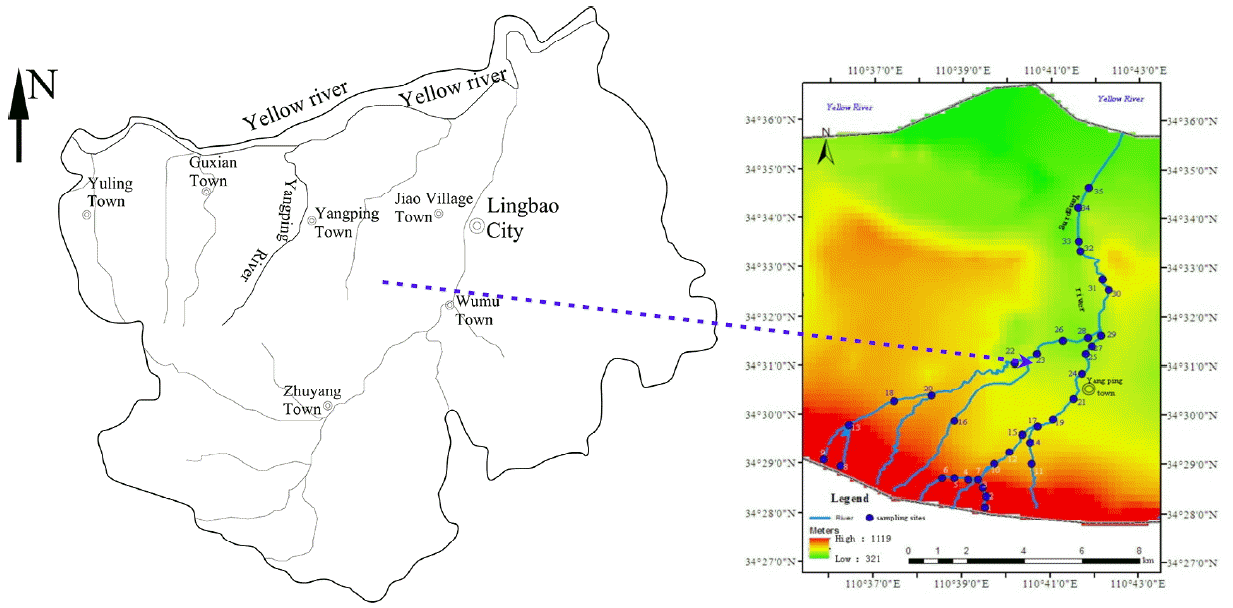
The Yangping River, which flows through the town of Yangping, is a tributaries of the Yellow River located in Lingbao City, China. The Yangping River basin is located roughly between latitude coordinates 34°28′N and 34°36′N and logitude coordinates 110°43′E and 110°38′E (Fig. 1). The direction of the river is determined by the terrain of Lingbao City, which is higher in the south than in the north. Lingbao City is one of the primary gold producing areas in China, as gold mining enterprises occupy approximately 76% of the entire city. With the rapid development of gold mining practices, surface water heavy metal pollution has become an increasingly relevant environmental problem in the region. While many rivers have been polluted by gold mining in Lingbao City, the Yangping River is polluted more seriously than other rivers in the region.
Samples of water were collected from levels 10 cm below the water’s surface and stored in 100 mL polyethylene bottles at each site.
Each bottle was washed more than three times in order to guarantee the accuracy of monitoring at each site. Collected samples were acidified with concentrated (conc.) HNO3 to pH < 2. Samples were kept on ice and brought to the laboratory, where they were stored for further analysis in a refrigerator with a temperature of four degrees Celsius. The coordinate of each site were measured by a global positioning system (GPS). Fig. 1 illustrates each site’s relative location – upstream or downstream – from the Yangping River. Two sample bottles were collected at each site for the purpose of parallel examination.
2.2. Analysis and Process of Sampling
In order to analyze the presence of heavy metal, 100 mL of acid treated samples were concentrated. If the solution remained feculent, it required the addition of HNO3 until the color appeared constant. Following this step, HCl (2%) was added to dissolve any salt in the sample until it reached heating condition. After the heating treatment, the mixture was concentrated to 2 or 3 mL and diluted with water to reach 100 mL for the analysis of Cu, Cd, Zn and Pb. The content of aforementioned metals was tested for by a graphite furnace atomic absorption spectrometer (SOLAR969Z, Thermo Electron Corporation, USA). The other 10 mL water samples of Hg and As were mixed with 5 mL of hydrochloric acid and 10% of 10 mL thiourea in order to be diluted to 100 mL required for analysis An Atomic Fluorescence Spectrophotometer (AFS-8330, Beijing Titan Instrument Co. Ltd, China) detected both elements. All of the reagents were characterized as guaranteed reagents (GR) in the process of testing and the selected water was ultrapure [14].
2.3. Pollution Assessment Methods of Heavy Metals
The most basic assessment method used is the single factor index, as this method is the most straightforward [8]. The pollution index for a single pollutant was established according to Eq. (1):
Where, Pi is the single factor pollution index; Ci (mg/kg) is the measured concentration of heavy metals; and Si (mg/kg) is the standard value of the pollutants. The value of the single factor index Pi < 1 indicates clean lines, 1–2 is regarded as low cleanliness, 2–3 is moderate, and Pi > 3 indicates high levels of cleanliness [8].
The Nemerow’s pollution index was used to evaluate the comprehensive pollution status of heavy metals [8]. This index is the most common and comprehensive pollution evaluation method. Not only it is reflected the single factor index Pi, but it emphasizes the influence of high concentration of heavy metal elements on environmental quality and eliminates the deficiency of average value on evaluation. The Nemerow’s pollution index can be calculated using Eq. (2):
Where PN is Nemerow’s pollution index; max Pi is the maximum single pollution index among the pollutants, and P̄i is the average mean of single pollution indexes of among all the pollutants.
The above two methods were applied in sediment and soil pollution evaluation at an early stage. However, they were also used to evaluate the heavy metal pollution of the surface water samples, which usually follows the standards of Class III of the Environmental Quality Standards of Surface Water of the People’s Republic of China (GB 3838-2002) [9]. The value of Nemerow’s pollution index PN < 1 indicates the clarity of water, 1–2.5 is low clarity, 2.5–7 is moderate, and PN > 7 indicates high clarity.
2.4. The Basic Principles of Novel Assessment Method
HCA is a statistical method used to classify data of regarding samples marked by similar characteristics; it has been used widely in the fields of medicine and biology and chemistry [16]. Among HCA, the similarity of characteristics is normally analyzed through Pearson’s correlation coefficient and Euclidean distance in HCA [17, 18]. In general, in order to ensure accuracy during classification, HCA will be used in combination with other methods of analysis, such as PCA [15]. In this study, we classified six heavy metals through HCA and PCA, both of which resulted in the same conclusion. This it indicated that it would be feasible in order to determine the groups of pollution sources.
PCA is one of the data analysis methods of the multivariate linear model. PCA is a special case of factor of analysis, as it transforms the original set of inter-correlated variables into a set of uncorrelated variables that represent linear combinations of the original variables. This is equivalent to rotating the coordinate space axes so that the covariance of each principal component (PC) is maximized. The main purpose of this technique is to remove the random deviation of principal components, so that the dimension of the complicated problem is reduced and the impact of measurement deviation is minimized [15].
PCA was applied in order to discover the source of the heavy metal pollutions. HCA was used to identify different geochemical groups, clustering together the sample stations with similar heavy metal contents [10]. PCA can obtain the proportion of the total variances that each PC represents [24]. The assessment result obtained from Nemerow’s pollution index will be same when calculated with max Pi if there are one or two very high single pollution indexes, which might influence the authenticity of result. Therefore, we proposed a unique assessment method to evaluate the pollution level of heavy metals in this study. This method is a pollution index based on PCA and the single pollution index and is obtained via the application of by Eq. (3):
Where Pαn is the original pollution index of nth site; Pi is the single pollution index of principal component; αi is the percentage of variance contribution of PC; α is the accumulation percentage of variance contribution of PC; and k is the number of PC. In this equation, the threshold value of pollution degree is similar to the Nemerow’s pollution index.
3. Results and Discussion
3.1. Statistics Analysis of Water Samples
As illustrated in Table 1, the maximum concentrations of As, Hg, Cu, Cd, Zn, and Pb in the Yangping River were found to be 0.017, 0.0009, 0.027, 4.460, 0.095, and 5.690 mg/L, respectively; the average values calculated were 0.004, 0.0003, 0.003, 0.896, 0.016, and 0.404 mg/L; and the coefficient of variation (CVs) were found to be 119.96%, 93.95%, 146.93%, 126.06%, 127.10%, and 236.95%, respectively. These six heavy metals displayed moderate variation, indicating the heavy metal concentrations of the water samples varied largely within the sampling areas. The maximum values of copper and zinc are below the national standard indicated Class II and above the standard indicated for Class I. The two heavy metals satisfy the standards put forth by the World Health Organization (WHO). The maximum values of mercury and arsenic are above the national standard of Class III and IV respectively. Both the maximum and average concentrations of cadmium and lead are above the national standards of surface water pollutants indicated by Class V standards and the upper scale of WHO. Statistical analysis, thus indicated that the heavy metals pollution in the Yangping River is, indeed, an issue.
3.2. Correlation Analysis
The single pollution index and Nemerow’s pollution index of samplings were calculated (Table 3) using the national standard as defined by Class III as the standard value of the pollutants (Si). The assessment result of PN revealed that 74.28% of water samples were highly polluted. The highest values of the single pollution index of Cd and Pb were based on compared figures are 892.000 and 113.900 respectively.
Statistical analysis shows it is possible to have pollution from different pollution sources via the investigation of the variation concentrations of the six heavy metals in the surface water of the Yangping River. Therefore, it is necessary to re-identify pollution sources of the heavy metals and evaluate the pollution levels.
The correlation analysis showed that there are complex relationships between the single pollution index of heavy metals in the water samples (Table 4). From the analysis, the correlation coefficients of As-Hg and As-Zn are equal to 0.699 (p < 0.01) and 0.339 (p < 0.05), respectively, suggesting a positive correlation exists between As and Hg but an insignificant correlation between As and Zn. The correlation coefficients of Hg-Cd, Cu-Zn, and Cu-Pb are equal to 0.605, 0.806, and 0.886 respectively, which are also positively related. The above analyses showed that Hg, As, and Cd may be derived from the same sources or may be influenced by the same factor or factors. Similarly, Pb, Cu, and Zn might also share sources or be influenced similarly. In order to reveal the sources of these elements, PCA, and HCA analysis methods were applied.
3.3. HCA
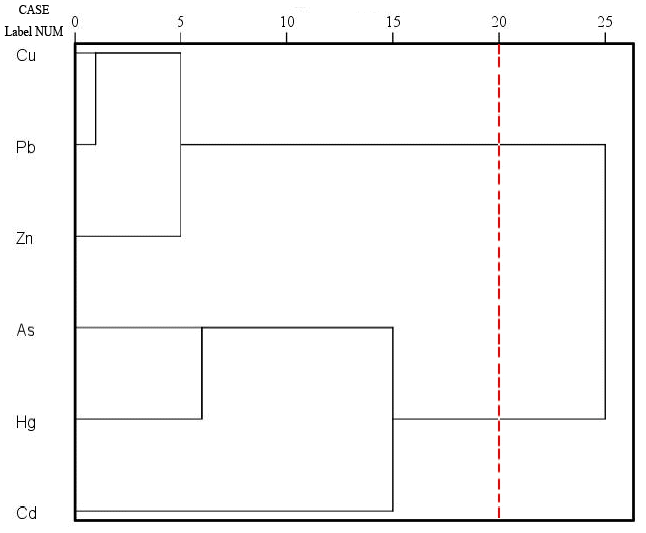
The HCA score plots described the characteristics of the samples and helped to determine temporal distribution; can be used for identifying categories of pollution sources [25]. Fig. 2 represents an HCA tree which was created using a Pearson correlation as measurement standard. From the results of the analysis, we can see two main clusters in the Fig. 2. Thus we can divide the heavy metals in the surface water of the Yangping River into two clusters. One cluster includes Cu, Pb and Zn, while the other is As, Hg and Cd. It has explained that six heavy metals contaminant may come from two kinds of different sources. The result of the HCA was consistent with that of the Correlation Analysis.
3.4. PCA
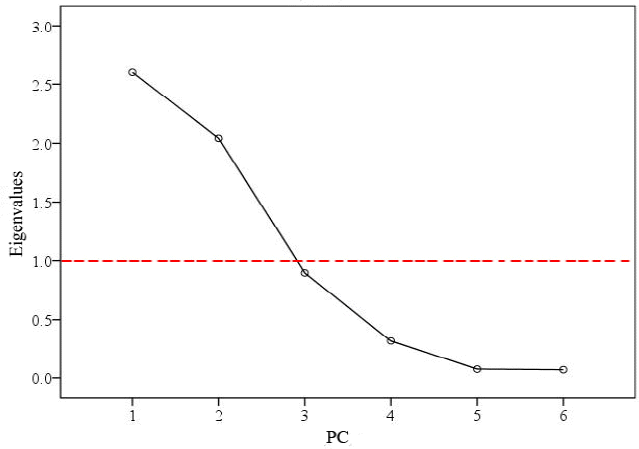
In Fig. 3 there are two values of PCs greater than 1, therefore, there are two components. Both Table 5 and 6 are the results of PCA. The results show that two principal components (PCs) explained approximately 77% of the total variance. The first and second components explain approximately 43% and approximately 34% of the total variance respectively. The eigenvalues of rotated PCs are nearly equal to the initial components. Thus, according to the component matrix, loading coefficients more or equal to 0.600 are used to define separate groups.
The first principal component (PC1) includes Cu, Zn and Pb, the corresponding loading coefficients are 0.966, 0.903 and 0.905 respectively. The second principal component (PC2) includes As, Hg and Cd, the corresponding loading coefficients are 0.789, 0.950 and 0.694 respectively (Table 6). By way of PCA, it becomes clear (Fig. 4) that Pb, Zn and Cu are one group; Hg, As and Cd comprise another group. This result coincides with the conclusions of both the correlation analysis and HCA. The concentration of the first group’s Cu and Zn levels were under the III water quality standard, while the concentration of Pb extended far beyond the indicated standard. Therefore, the pollution sources of this group must have a close relationship with the smelting methods of lead ores, which is due to the fact the there are many lead plants near the river [26, 27]. From above analysis, we can draw the conclusion that lead can represent the contamination of the group.
In the second group, the positive loading modulus of Hg (0.950) is higher than the other two heavy metals (As and Cd). Table 6 shows that the factor Hg is the highest value of the loading modulus. This illustrates that gold mining and gold ore processing have affected the water quality of the river. However, the single pollution index of Cd is greater than others. This illustrates that Cd pollution is more serious than Hg and As pollution in the PC2. All of the single pollution indexes (Pi) of Cd are greater than other two heavy metals in this group. The contamination position is mainly located at sampling sites S19, S21, S24, S25, S27 and S29.
3.5. Assessment of Heavy Metal Pollution
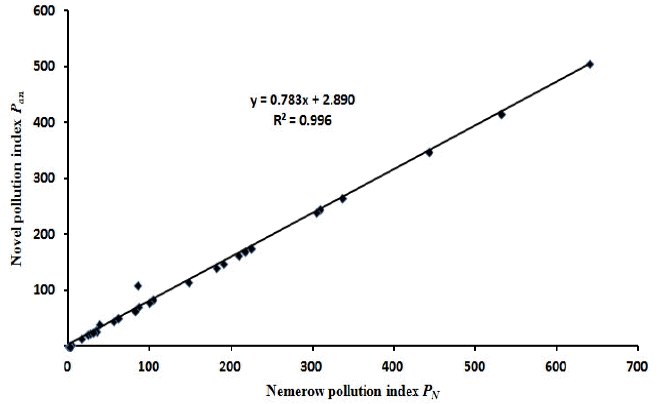
There exist 26 water samples that have been categorized with a high degree of pollution according to the results of Nemerow’s pollution index (Table 3). Moderate, low, and clean water samples categorizations include one, three, and five samples respectively (Table 7). The relative coefficient square is equal to 0.996 between Pαn and PN, which indicates that the assessment result of the new method was in sync with Nemerow’s pollution index (Fig. 5).
The results of both indicate shows that sample S13 was clean and the sample S24 contained high levels of pollution (Table 3, Table 7). The contents of S13 were collected at the mountain far from the town of Guxian. Meanwhile the contents S24 of were collected downstream of Guxian. The results are indicative of the fact that there are many gold mining and smelting workshops in Guxian, much of the waste water discharges into the Yangping River. Therefore, the value of Pan can serve as a new assessment index used to evaluate the heavy metal pollution of water samples. However, this method has only been used to monitor heavy metals pollution in the Yangping River, and is therefore only known to be acceptable. In future research, we hope to study more monitoring data in other sites of polluted surface water using this approach to advance the evaluation methods.
4. Conclusions
Via the application of extensive statistical analysis, this article argues that the water of the Yangping River suffer from seriously heavy metal pollution as defined by the Surface Water Quality Standards of the People’s Republic of China (GB 3838-2002) [27] and the Drinking Water Guidelines from the World Health Organization (WHO) (4th ed., 2011) [28]. The results of Pearson’s correlation analysis, PCA and HCA, which all indicate that the elements Cu, Pb and Zn belong to one contaminant group; while As, Hg, Cd belong to another. These groups of heavy metals might be derived from different pollution sources. The two principle components accounted for up to 43.341% and 34.036% of total variance respectively.
The new proposed assessment method overcomes the disadvantage of Nemerow’s pollution index by utilizing the maximum value of the single factor index. Using linear regression analysis, the original assessment result of the proposing method is consistent with that of Nemerow’s pollution index. This assessment method, however, may have some deficiencies and requires verification through more research in order to be applied to cases other water polluted sites.