1. Introduction
The need for unconventional fuel feedstocks such as biofuels emerges due to the environmental consequences of utilizing conventional fossil fuels such as the gaseous emissions [1–3]. Biodiesel is a biofuel that is typically produced from oleaginous crops via the transesterification of their oils with methanol or ethanol to produce fatty acid methyl esters (FAME). These crops include rapeseed, soybean, sunflower, and palm [2–4].
Microalgae are eukaryotic aquatic photosynthetic microorganisms capable of harvesting the solar energy effectively to produce biomass that is ideal for the production of biodiesel [2, 5–7]. Microalgae, similar to plants, convert solar energy to chemical energy via photosynthesis, producing organic biomass from carbon dioxide and water. Approximately, 1.83 kg carbon dioxide is fixed for each 1 kg biomass produced [8]. There are many advantages to producing biofuels from microalgae such as the high areal yield, along with avoiding competition for fertile soil; since microalgae can grow on non-arable lands, using non-potable water, in a continuous rather than seasonal mode with a significantly lower water consumption rate and in an aqueous suspension system that provides more access to nutrients and water [1–4, 8–9]. Additionally, biodiesel derived from microalgal lipids is sustainable and renewable in nature with lower harmful emissions such as CO, hydrocarbons, and particulate matter, and no SOx emissions, besides the potential of utilizing the carbon dioxide portion of the flue gas from power plants as a carbon source for the growth of microalgae [1, 6, 8].
Neochloris oleoabundans is a freshwater and saline media microalga from the Chlorophyceae class and the Chlorococcaceae family [1, 10]. Li et al. [6] pointed out that this microalga is promising; as the lipid productivity of this species was nearly twice that of any other microalga studied for the purpose of biodiesel production. Moreover, the majority of the fatty acids produced by this microalga are saturated fatty acids in the range of 16–20 carbons, which makes this microalga ideal for biodiesel synthesis, even though most of the previous studies reported utilizing this species as a feeding source for aquaculture species such as mussels [6]. The highest biomass concentrations reported in the literature for the phototrophic cultivation of this microalga were in the 2–5.17 g/L range [6, 11–15].
A major challenge to the production of biodiesel from microalgae is the relatively high capital and operational costs compared to conventional fossil fuels due to cultivation requirements [5, 9]. Nutrients availability, mainly nitrogen and phosphorus, is a key factor for the growth of microalgae, which adds to the production cost. Industrial, municipal, and agricultural wastewaters may provide the necessary nutrients for the growth, where microalgae remove nitrogen and phosphorus from wastewater via direct uptake. Moreover, the oxygen produced by microalgae can be utilized by the aerobic bacteria for further reduction in the organic matter [3, 7, 16]. Microalgae such as Chlamydomonas, Botryococcus, Chlorella, Haematococcus, Spirulina, and Scenedesmus have been utilized for wastewater treatment [16]. For instance, Tam and Wong [17] reported that the microalga Chlorella pyrenoidosa grew well when cultivated using supernatant from the preliminary and primary sedimentation and the secondary effluent from an activated sludge process. In addition, Choi and Lee [16] stated that nitrogen and phosphorus removal efficiencies of 81–85% and 32–36%, respectively, were achieved when the microalga Chlorella vulgaris was cultivated with wastewater from the preliminary sedimentation of a sewage plant. However, growth inhibition caused by elevated concentrations of ammonia, urea, and volatile fatty acids may limit the use of microalgae as means of secondary wastewater treatment [18, 19].
Anaerobic digestion of animal manure is an often-used approach to reduce the biological oxygen demand in the waste. However, nutrients are not eliminated via this route; in fact they become more bioavailable in the forms of ammonium and phosphate. Using the anaerobic digestate (AD) to cultivate microalgae has some challenges including the potential high and unbalanced concentrations of nutrients, turbidity, other competing microorganisms, as well as the potential toxicity cause by elevated COD and ammonia concentrations; therefore, diluting the AD may become necessary before microalgae inoculation [3, 7]. Furthermore, pretreatment methods such as autoclaving, filtration, or other techniques are often applied to wastewaters in general and AD in particular prior to microalgae cultivation in order to reduce the suspended solids concentration as well as prevent interference from other microorganisms such as bacteria or protozoa [16, 20].
Several studies indicated the potential of growing the microalga N. oleoabundans using the anaerobic digestion effluent or digestate [3, 21, 22]. However, the range of dilutions covered by each individual study was narrow. For instance, Levine et al. [3] inoculated N. oleoabundans in 50-, 100-, and 200-fold diluted anaerobic digestion effluent under 200 μmol/m2/s light intensity. They concluded that 50-fold dilution which was equivalent to 60 mg N/L total nitrogen; 2.6 mg P/L phosphorus; and 42 mg N/L ammonia, yielded the highest growth rates. Yang et al. [22] analyzed the effluent supernatant from the anaerobic digestion of rice hull, soybean, and catfish wastes. The ammonium concentrations for these waste categories were 258–293 mg/L, 743–787 mg/L, and 3,105–3,684 mg/L, respectively. They found that the growth in the 50-fold diluted effluent yielded the highest biomass growth rate compared to other dilutions regardless of the waste category. Franchino et al. [21] reported the cultivation of N. oleoabundans using 10-fold to 25-fold diluted cattle slurry and raw cheese whey anaerobic digestion effluent with an initial (undiluted) ammonium concentration of 1,634 mg N/L. They found that there was no significant difference in the growth among all dilutions. The aforementioned studies on the anaerobic digestion liquid waste as a nutrient medium focused on filtration, autoclaving, or centrifugation as necessary steps ahead of microalgae cultivation in order to eliminate the suspended solids as well as the interference from other microorganisms. According to Levine et al. [3], there was no significant difference between raw and autoclaved diluted effluent on the microalgae biomass productivity. It was thought initially that the native bacteria within the effluent produce vitamin B12, which is necessary for the growth of microalgae. Additionally, the heterotrophic microorganisms may contribute to the growth of microalgae by remineralizing nutrients and producing carbon dioxide as a result of organic carbon oxidation [3]. On the other hand, centrifugation is an energy intensive process, which may limit its applicability as a pretreatment step to the anaerobic digestate [23].
In this study, the AD from two sources was characterized in order to be used as a nutrient source for microalgae. Several pretreatment methods other than those discussed in the previous studies were explored including filtration with variable mesh sizes, hydrogen peroxide oxidation, and supernatant extraction. The purpose of these treatment methods was to reduce the suspended solids in the nutrient medium as well as eliminate the potential toxicity caused by elevated concentrations of organic and inorganic matter. Further, the growth of the microalga N. oleoabundans using diluted AD was evaluated by a bench-scale experiment using 16 mm round glass vials. This experiment covered unfiltered and filtered digestate as well as a wider range of dilutions compared to the previous studies in literature.
2. Materials and Methods
2.1. Anaerobic Digestate
AD was sampled from two sources in Columbus, OH. Source A is a commercial digester where animal manure and other organic wastes are digested anaerobically to produce biogas, while source B is an anaerobic digester processing waste activated sludge from a domestic wastewater treatment plant. Samples were brought to the laboratory and stored at 4°C until the time of analysis.
2.2. Analytical Methods
Measurements of total solids (TS), volatile solids (VS), total suspended solids (TSS), volatile suspended solids (VSS) were performed according to the APHA Standard Methods for the Examination of Water and Wastewater (methods 2540 B, D, and E) [24]. Chemical oxygen demand (COD), total nitrogen, total phosphorus, and ammonia nitrogen were determined according to the colorimetric methods in compliance with APHA Standard Methods for the Examination of Water and Wastewater and EPA methods (HACH methods 8000, 10072, 10127, and 10031) using HACH DR 3900 spectrophotometer. Cations such as iron, calcium, magnesium, manganese, and potassium were measured using Thermo Scientific iCAP 6300 ICP spectrometer. Samples were analyzed in triplicates and expressed as mean ± standard deviation. Total and filtered concentrations as shown in Table 1 refer to well-mixed samples and filtered samples through 0.45 μm syringe filters, respectively. Zeta potential measurements were conducted on diluted digestate using Brookhaven ZetaPlus analyzer. Finally, microalgae biomass concentration was quantified as the optical density at 750 nm (OD 750) using HACH DR 3900 spectrophotometer.
2.3. Pretreatment Methods
2.3.1. Filtration using polyester filter bags
The AD’s from sources A and B were diluted with deionized (DI) water to 1% and 2%, respectively. These dilutions were selected based on the differences between the two sources in terms of nutrients and solids content (Table 1). For instance, nitrogen concentration in source A was twice that of source B; therefore, the dilution was selected so as to yield total nitrogen concentration within the detection limits of the colorimetric method. The diluted digestate was then filtered using 10, 5, and 1 μm welded polyester filter bags (16″ length and 7″ diameter, Duda Energy) and the filtrate was sampled and analyzed for OD 750, TSS, COD, total nitrogen, and total phosphorus.
2.3.2. Hydrogen peroxide treatment
Hydrogen peroxide (H2O2) is a strong oxidant that can be used alone or combined with other oxidation techniques such as UV light and ozone or with a catalyst such as iron [25, 26]. The AD’s from sources A and B were diluted with DI water to 1% and 2%, respectively for the same reason mentioned in Section 2.3.1. The stoichiometric hydrogen peroxide dosage is 2 moles 30% H2O2 per 1 mole of COD. The experiments were conducted using three dosages of 30% H2O2: 0.5, 1.0, and 1.5 times the calculated dosage based on COD. These dosages were 1.96, 3.92, and 7.84 mL 30% H2O2/L of source A 1% diluted digestate and 2.22, 4.44, and 8.89 mL 30% H2O2/L of source B 2% diluted digestate. The solutions were kept in Erlenmeyer flasks on a shaker plate at 200 RPM for 2 h. In addition, a combination of UV/H2O2 treatment was applied to both sources with 1.0 × calculated H2O2 dosage as an advanced oxidation process, which is expected to improve the oxidation efficiency due to the generation of hydroxyl radicals [25]. After the hydrogen peroxide dosage was added, the solution was recirculated for 30 min through a Turbo-Twist 3x UV unit (Coralife products) with a wavelength of 253.7 nm and an irradiation of 9,580 μW/cm2. Samples were collected at the end of the mixing period and were analyzed for OD 750, TSS, COD, total nitrogen, and ammonia.
2.3.3. Supernatant characterization
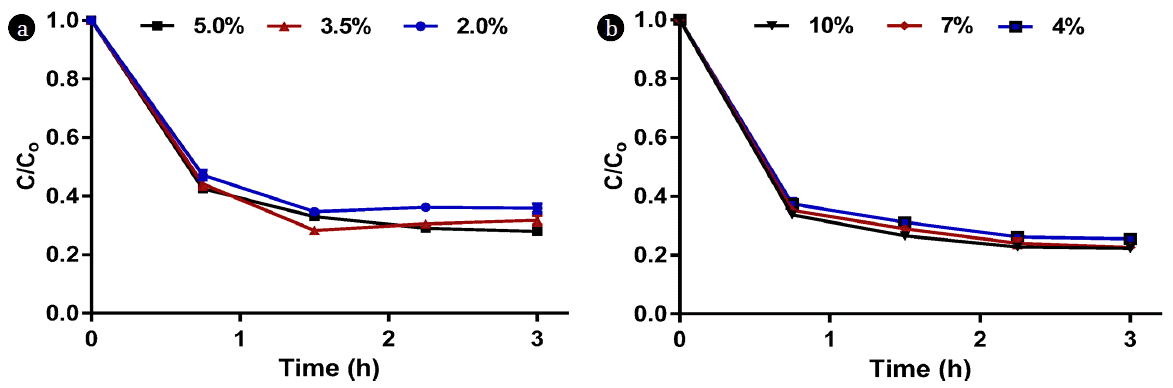
Three dilutions from each AD source were tested. These dilutions were most likely to be used for microalgae cultivation. 5%, 3.5%, and 2% dilutions of source A, and 10%, 7%, and 4% dilutions of source B were prepared and poured in eight 50 mL centrifuge vials per dilution; hence, the total number of vials was 48. These vials were left undisturbed to settle and exactly 30 mL supernatant was extracted from two vials per dilution every 45 min for a total sampling time of 3 h using a pipette and the remaining sludge in the bottom of each vial (15 mL) was disposed. The supernatant was analyzed for OD 750, TSS, COD, total nitrogen, and total phosphorus and the results were expressed as C/Co, where C is the concentration at time t and Co is the initial well-mixed concentration.
2.5. Microalgae Cultivation Using Diluted AD
A bench-scale experiment was conducted to evaluate the growth of N. oleoabundans using diluted AD by inoculating 4 mL of nutrient medium with 1 mL of microalgae culture that was previously cultivated phototrophically using BG-11 medium (average OD 750 of the microalgae inoculum was 0.15) and in the same cultivation conditions listed below. The control nutrient medium was BG-11 medium; and therefore, the highest concentrated dilutions were prepared to match the nitrogen concentration in BG-11 medium (250 mg N/L). All dilutions were conducted in five replicates in 16 mm round glass vials and placed inside an incubator at 25°C with a 14:10 light:dark cycle using two built-in fluorescent lamps providing an average light intensity of 50 μmol/m2/s. The biomass concentration was monitored frequently by placing each vial directly in the spectrophotometer and obtaining an OD 750 value.
3. Results and Discussion
3.1. AD Characterization
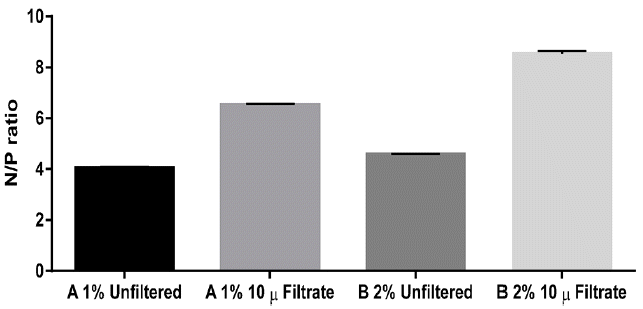
Samples of AD from sources A and B were diluted with DI water and characterized as shown in Table 1. It is clear that source A is richer in most of the parameters than source B. For instance, total nitrogen in source A is twice that of source B. Approximately 65% of the total nitrogen in source A exists in the form of ammonia, while ammonia is only 49% of the total nitrogen in source B. The difference in the nutrients concentrations between the two sources is reflected on the selection process. Source A, for example, contains higher concentrations of nitrogen and phosphorus compared to source B; thus, it will require more dilution to achieve a target nitrogen or phosphorus concentrations as opposed to source B. Another difference is that source A contains higher ammonia concentration compared to source B; thus, if the two sources are diluted to the same nitrogen concentration, source A might not be favorable for some microalgae species due to the higher ammonia content, and the growth can be inhibited beyond certain threshold. Unfiltered phosphorus was also significantly higher in source A, but the filtered phosphorus in source B was higher than that in source A. Moreover, the N/P ratio was 4 for the unfiltered source A, 4.6 for the unfiltered source B, 8.1 for the filtered source A, and 3.1 for the filtered source B. The variation of the N/P ratio may affect the biomass productivity of microalgae, but this is species-dependent. For instance, Wang and Lan [14] studied the impact of N/P ratio on the growth of the microalga N. oleoabundans in artificial wastewater and under surplus phosphorus concentrations. The nitrogen concentration was varied by enriching the media with 45-218 N-NO3−/L sodium nitrate concentration, and the corresponding N/P ratios were in the 0.42–2.02 range. The optimal cell growth was observed at 140 mg N-NO3−/L (N/P = 1.33). Under constant nitrogen concentration of 140 mg N-NO3−/L, and N/P ratio in the 3–26.4 range, the highest biomass concentration was observed at 47 mg P-PO43−/L initial P concentration (N/P = 3). They also concluded that low N/P ratio is necessary for complete nitrogen removal. For example, at 140 mg N/L, they found that the N/P ratio should be less than or equal to 3 for complete nitrogen removal from the artificial wastewater. In contrast, phosphorus removal was independent of N/P ratio [14]. Finally, source A contained higher Fe, K, and Na concentrations compared to source B, whereas the concentrations of Ca and Mg were higher in source B.
Although filtration using 0.45 μm syringe filters reduces turbidity and removes suspended solids from the diluted digestate, it does not necessarily improve the media to support the growth of microalgae. For example, the elevated ammonia concentrations in filtered compared to unfiltered digestate may have negative impact on the growth of many microalgae species. Besides, 0.45 μm filtration would be expensive on a larger scale.
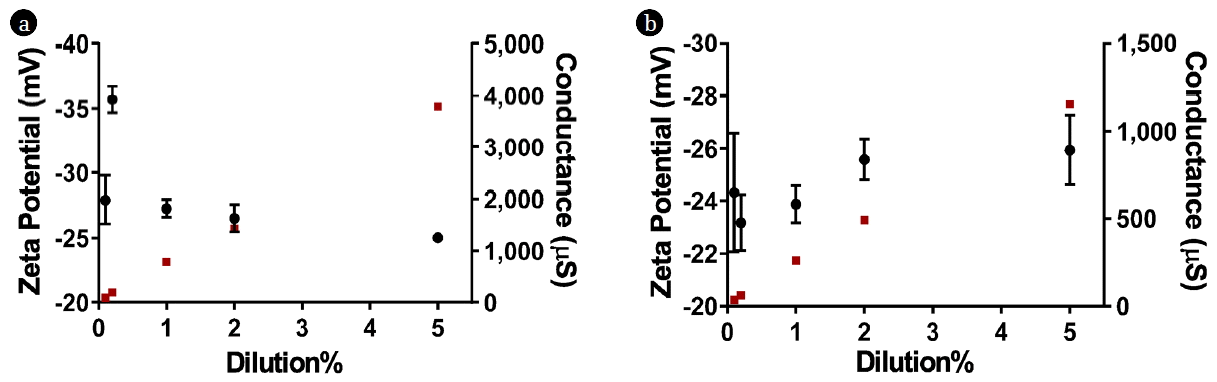
3.2. Zeta Potential
Zeta potential is an appropriate way to measure the electrophoretic mobility of the solids in a suspension, and is often used to determine the surface properties of sludge flocs [28, 29]. According to Liao et al. [30], the hydrophobicity of sludge decreases with an increase in the surface charge. It was observed in our experiments that diluting the AD resulted in improved settleability of the suspended solids; therefore, zeta potential measurements were conducted on 0.1%, 0.2%, 1%, 2%, and 5% diluted digestate from both sources as shown in Fig. 1. The higher concentration digestate (> 5% dilution) resulted in unstable readings from the instrument; thus, they were excluded from the analysis.
No clear correlations between the dilution% and zeta potential were found (Fig. 1). The values ranged from − 35.71 to − 25.02 mV for source A digestate, whereas the corresponding values for source B ranged from − 25.95 to − 23.17 mV. Su et al. [31] investigated the impact of dilution on the zeta potential of aerobic granular sludge. They concluded that concentrations higher than 10 g TSS/L resulted in unstable zeta potential readings. Furthermore, they reported that there was no clear relationship between TSS concentration and zeta potential over the range of 0.1–8.0 g TSS/L [31]. In our analysis, the range of TSS concentrations tested for zeta potential was 0.032–1.7 g/L. Morgan et al. [32] indicated that sludge solids carry a negative charge regardless of the sludge type. Moreover, they postulated that the amount of negative charge carried by the sludge solids was due to the extracellular polymers (ECPs) yield; as the activated sludge solids had higher negative charge and ECPs yield compared to the AD sludge. The lower ECPs generated in the AD sludge can be related to the potential degradation of these biopolymers by bacteria to form methane and carbon dioxide. On the other hand, there was a strong correlation between the dilution% and conductance in both sources; which relates to the total dissolved solids concentration.
3.3. Filtration Using Polyester Filter Bags
Elevated concentrations of COD and organic carbon in particular may negatively impact the growth of microalgae due to rapid microbial growth [33]. For instance, Travieso et al. [34] reported that COD concentrations as high as 1,100 mg COD/L inhibited the growth of Chlorella vulgaris when cultivated using piggery wastewater.
Filtration using polyester filter bags is a convenient and relatively low cost method for the removal of solids from liquid media such as wastewater. There was a significant reduction in all parameters when comparing the unfiltered diluted digestate with the filtered liquid (Table 2). OD 750, which reflects the turbidity of the liquid, decreased by 0.398 units and 0.514 units for the 10 μm filtrate for sources A and B diluted digestates, respectively. Further reductions were not significant with finer filtration using the 5 and 1 μm filter bags. For the cultivation of microalgae using the AD, the initial turbidity of the nutrient media can become a limiting factor due to light attenuation in the highly concentrated solutions. TSS results follow the same pattern; as 89% and 85% of the TSS were retained on the 10 μm filter bags for the diluted sources A and B digestates, respectively. COD was reduced by 61% and 76% when the diluted sources A and B digestates were filtered through the 10 μm filter bags, respectively. Filtration using smaller mesh sizes did not result in significant additional reductions in COD. Total nitrogen was reduced by 27% and 39% when the diluted sources A and B digestates were filtered through the 10 μm filter bags, respectively. Finer filtration did not yield any additional reductions in nitrogen concentrations. The reduction in phosphorus was more apparent by filtering the diluted digestate through the 10 μm filter bags; as 55% and 68% of the total phosphorus was removed from sources A and B diluted digestates, respectively. Similar to total nitrogen, finer filtration did not yield any additional significant reduction in the total phosphorus content in both digestates.
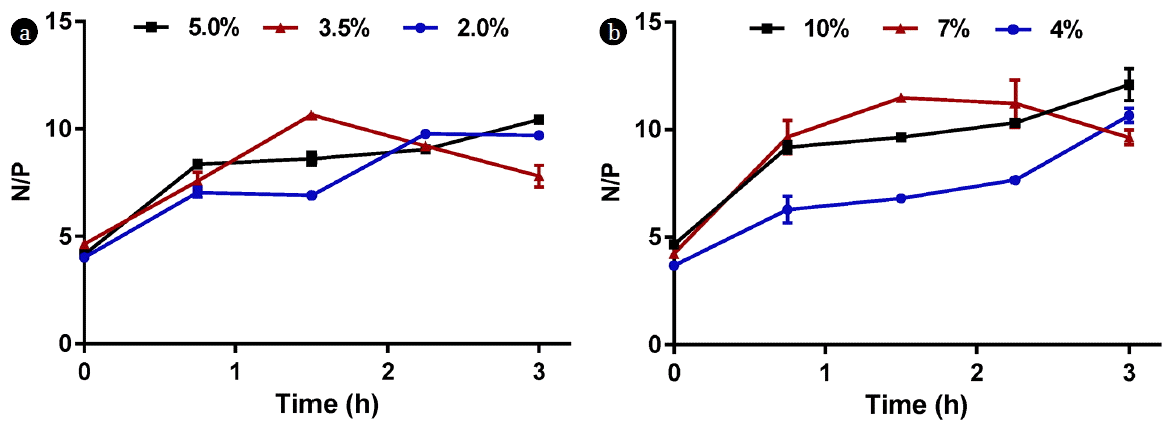
The impact of filtration on the N/P ratio was higher in the case of source B digestate as the ratio increased from 4.6 to 8.5, whereas the initial ratio in source A digestate was 4 which increased to 6.5 after filtration as shown in Fig. 2. In addition, the remainder of the nitrogen in the filtrate was 80–90% ammonia; which may not be the favorable nitrogen form for many microalgae species in comparison to nitrates and organic nitrogen. Overall, filtration using 10 μm filter bags is an attractive option to reduce the suspended solids and COD contents of the diluted AD. However, elevated ammonia concentrations have to be taken into consideration when preparing nutrient media for the growth of microalgae.
3.4. Hydrogen Peroxide Treatment
The purpose of hydrogen peroxide treatment was to evaluate the potential of oxidizing the COD and ammonia in the diluted AD. Chemical oxidation is a process that has many applications in the water and wastewater treatment. Taste and odor control, disinfection, hydrogen sulfide removal, and color removal are amongst the applications of chemical oxidation in water treatment [25].
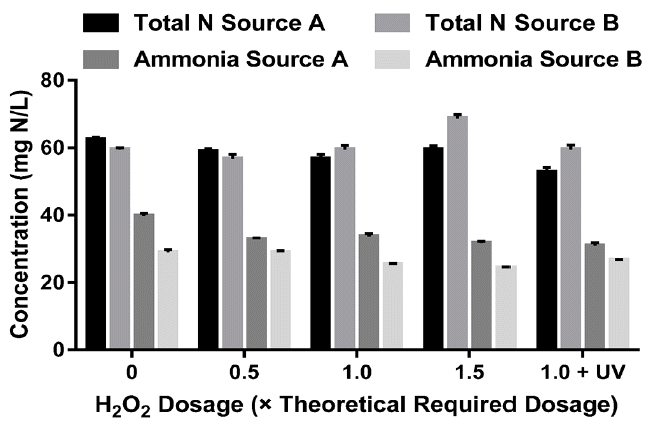
The theoretical dosage of 30% H2O2 was estimated based on the COD content. Then 0.5, 1.0, and 1.5 times the theoretical dosages were applied for each source as indicated in the Materials and Methods section. As shown in Fig. 3, TSS concentrations decreased as a result of hydrogen peroxide pretreatment. The maximum reduction observed in the case of source A was 29% with 1.5 × dosage, while the maximum reduction was 13% for source B with the same dosage. Similar pattern can be noticed with OD 750 as the initial OD 750 value decreased from 0.383 with no hydrogen peroxide to 0.293 with 1.5 × dosage for source A, whereas for source B, OD 750 decreased from an initial value of 0.556 to 0.484 when the 1.5 × dosage was applied. There was a slight decrease in the COD (< 5%) when half the theoretical dosage of hydrogen peroxide was used for both sources. However, for higher dosages (1 and 1.5 × dosage), the COD values were higher than the initial, which suggests that the residual hydrogen peroxide interfered with the spectrophotometric COD measurement.
Similar trends were observed when the digestate samples were treated with a combination of UV and hydrogen peroxide. This may indicate that hydrogen peroxide is not an effective oxidant for the COD in the diluted AD. The same interference was observed with the total nitrogen measurement, particularly for source B (Fig. 4). On the other hand, ammonia concentrations decreased with an increase in the hydrogen peroxide dosage. The maximum reduction was 22% for source A with 1.0 dosage + UV whereas 1.0 × dosage without UV resulted in 15% reduction in ammonia. The maximum reduction of ammonia for source B was 16% when the 1.5 × dosage of hydrogen peroxide was added to the solution. It is not clear however, whether the ammonia that is lost has been converted to nitrogen gas or to nitrate, as the total nitrogen tests were inconclusive due to the interference of hydrogen peroxide residual.
In summary, hydrogen peroxide pretreatment was not an effective way to decrease the COD of the diluted AD or to oxidize the organic nitrogen and ammonia. This can be related to the high alkalinity in the AD which decreases the efficiency of advanced oxidation processes such as ozone or peroxide; as bicarbonate is a radical scavenger [20].
3.5. Supernatant Characterization
This experiment was conducted based on a previous observation that solids tend to settle over time in the diluted AD, unlike the raw digestate in which solids remain in suspension. It is thought that the dilution process helps in improving the settleability of the digestate. Pere et al. [29] indicated that the heavily loaded sludges tend to have higher zeta potential; i.e., they were more hydrophilic, which could be due to the increased content of ECPs, which affects the viscosity as well as the settling characteristics due to bioflocculation [29, 32].
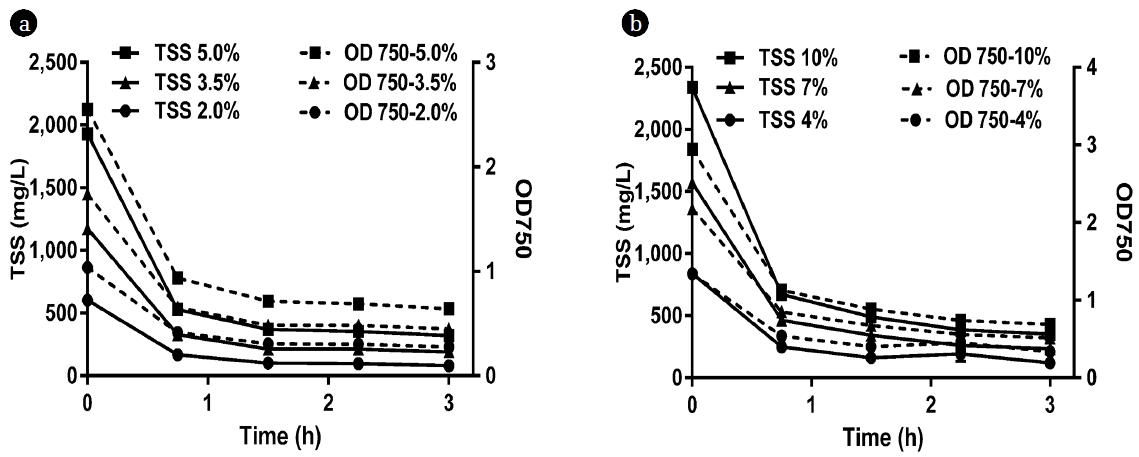
The optical density values presented in Fig. 5 indicate that the more concentrated dilutions exhibited the highest reductions of OD 750 as the overall OD 750 reductions were 1.91, 1.29, and 0.76 for the 5%, 3.5%, and 2% source A dilutions, respectively and 2.25, 1.66, and 1.00 for the 10%, 7%, and 4% source B dilutions, respectively. This is equivalent to 83–87% reduction in TSS concentration for both sources; as the final TSS concentrations after 3 h were 320, 191, and 81 mg/L for the 5%, 3.5%, and 2% source A dilutions, respectively and 352, 235, and 120 mg/L for the 10%, 7%, and 4% source B dilutions, respectively. However, the high OD 750 values observed in the supernatant after 3 h of settling may not be suitable for the growth of microalgae due to the higher turbidity and thus the lower light penetration, suggesting additional dilution might be required.
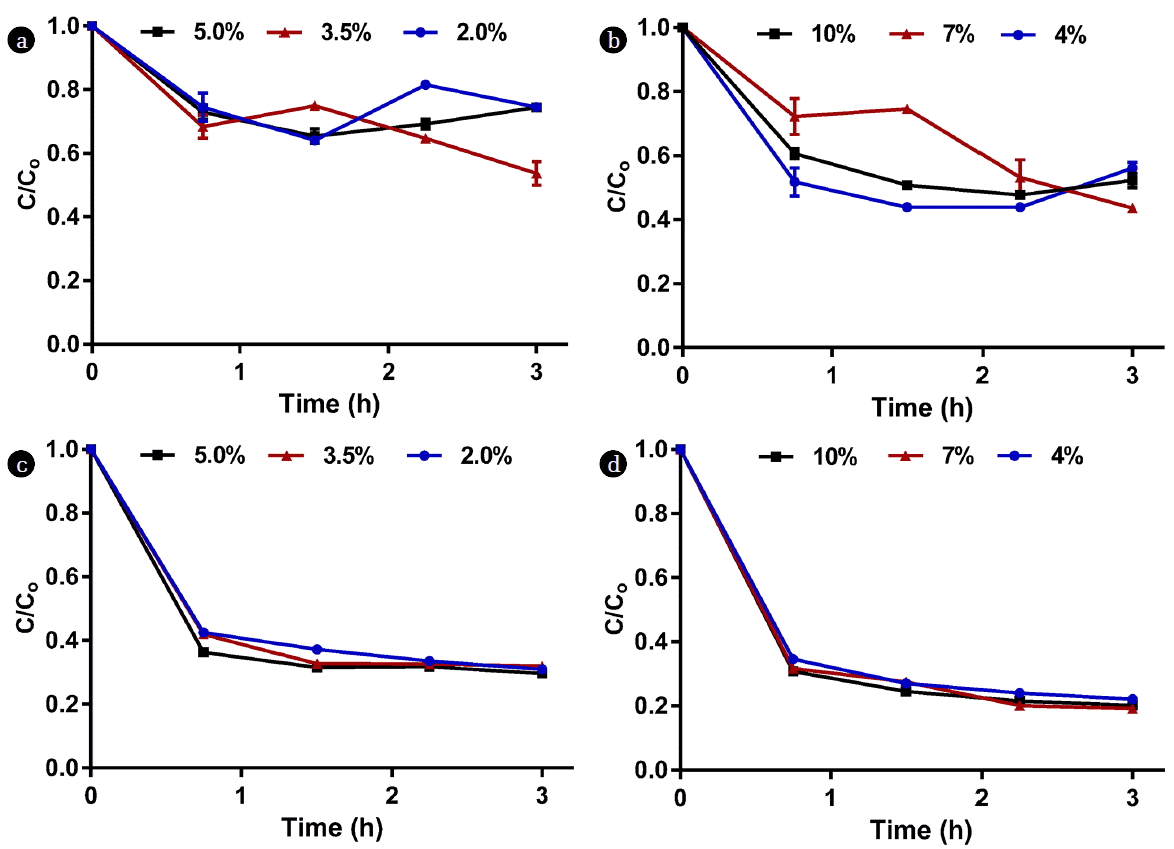
Fig. 6 and 7 show the COD, nitrogen, and phosphorus concentrations in the supernatant as a function of time. As indicated in the Materials and Methods section, supernatant samples were extracted every 45 min and analyzed, and the C/Co ratios were plotted for each parameter over time; where Co is the initial concentration for the well-mixed sample, while C is the measured concentration at time t. It is clear from Fig. 6 that the major reduction in COD occurred within the first hour for both sources. Regardless of dilution, COD decreased by approximately 55–60% for source A and 65–70% for source B in the first hour. The overall COD reductions after 3 h of monitoring were 64–82% for source A and 74–78% for source B. Approximately 30% of total nitrogen was lost in the first hour in source A due to solids settling whereas the reduction in source B was in the range of 27–52% (Fig. 7a, 7b). The reduction in phosphorus was more apparent than nitrogen as approximately 70 – 80% of source A’s total phosphorus was lost in the first hour compared to 70–73% for source B (Fig. 7c, 7d). As a result, the N/P ratio varied over time as shown in Fig. 8.
In summary, the supernatant extraction method appears to be the most attractive and least expensive pretreatment method. Compared to hydrogen peroxide treatment, supernatant extraction was more effective in decreasing the TSS and COD contents of the digestate. On the other hand, the removal efficiencies of TSS and COD of the supernatant extraction method were comparable to those achieved with polyester filter bags; however, the cost of filters decreases the feasibility of filtration in comparison to supernatant extraction. Additionally, the supernatant experiments can be useful in evaluating the settling per unit depth and/or area over time. For example, if we consider the 5% dilution of source A, the COD removal in the first 45 min was 491 mg/L, from which the COD flux for the control volume of 30 mL and over the depth of 5.5 cm is equivalent to 3.57 mg/cm/h. Therefore, if the same removal efficiency is desirable and the initial COD content is known, the required retention time can be estimated based on the reactor depth assuming a discrete settling where solids do not tend to flocculate and particles settle without interaction [35].
In general, after diluting the two sources, both behaved similarly in terms of nutrients as well as the suspended solids removal. However, nitrogen decreased to lower levels in source B compared to source A. This means that in order to match a certain nitrogen concentration, the supernatant extracted from source B has to be diluted even less than source A. As a result, the turbidity of the target dilution will be higher, which will affect the phototrophic growth of microalgae due to light attenuation. Moreover, source B dilutions appeared to have separation in the form of foamy layer on the surface, which interfered with the process of supernatant extraction and in fact contributed to more solids in the decanted liquid. Accordingly, source A was selected as a nutrient source for the growth of the microalga N. oleoabundans.
3.6. Microalgae Cultivation
The microalga N. oleoabundans was cultivated using diluted AD as stated earlier. Source A AD was used, however, it was a different batch from the earlier one characterized in the previous sections. For instance, the total nitrogen in the well-mixed digestate was 4,775 mg N/L compared to the initial batch value of 5,567 mg N/L. Total phosphorus in this batch was 1,507 mg P/L compared to 1,381 mg P/L in the initial batch. Similarly, 0.45 μm syringe filtered nitrogen and phosphorus concentrations were 2,525 mg P/L and 483 mg P/L, respectively. Finally, the supernatant, which was extracted after 3 h of gravity settling, had undiluted nitrogen, phosphorus, and ammonia concentrations of 4,460 mg N/L, 538 mg P/L, and 2,490 mg N/L respectively. These concentrations were actually close to those obtained in the supernatant extraction experiment discussed earlier, where the majority of nitrogen remained in suspension regardless of the dilution. For instance, the average undiluted nitrogen concentration for the last 2 h of the supernatant extraction experiment was 4,633 mg N/L for the 5% dilution, 4,386 mg N/L for the 3.5% dilution, and 4,229 mg N/L for the 2% dilution. The corresponding undiluted phosphorus concentrations averaged 517 mg P/L for the 5% dilution, 510 mg P/L for the 3.5% dilution, and 511 mg P/L for the 2% dilution. As a result, the two batches resembled each other considerably, but it is always important to characterize the digestate prior to microalgae cultivation; as the anaerobic digestion process and its digestate can vary significantly depending on the feedstock and the operational conditions.
A range of 5–250 mg N/L was targeted by extracting the supernatant of the 5.71% diluted digestate which yielded a nitrogen concentration of 250 mg N/L and sequentially diluting this supernatant as shown in Table 3. The 0.45 μm filtered digestate was diluted as well to a range of 0.2 – 10% (Table 3).
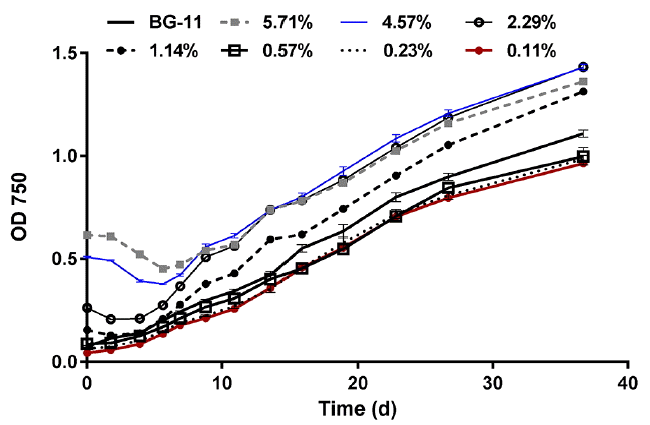
As shown in Fig. 9, the nutrient media contributed to the initial turbidity of some cultures, mainly the 5.71%, 4.57%, and 2.29% supernatant, as the OD 750 measurements of these dilutions (without microalgae inoculation) were 0.780, 0.619, and 0.285, respectively. Shortly after the cultures were inoculated, OD 750 of these three dilutions in addition to the 1.14% dilution cultures decreased, but after 4–6 days, OD 750 started to increase again. This may indicate a lag phase of the microalgal growth concurrent with direct consumption of the particulate substrate or bacterial production of extracellular enzymes to hydrolyze and solubilize the particulates. In order to verify this, additional vials were inoculated with 4 mL of the supernatant dilutions and 1 mL deionized water. The OD 750 of the new vials was monitored in order to assess if the particulate matter dissolution was a result of direct consumption by microalgae or another reason such as bacterial activity. The results indicated that after 5 days, the OD 750 of the 5.71%, 4.57%, 2.29%, and 1.14% decreased by 0.072, 0.045, 0.017, and 0008, respectively (Fig. 11). As a result, it is likely that both native bacteria and microalgae contribute to the decrease or dissolution of the particulate matter.
The growth in the lower dilutions resembled that in the BG-11 culture in terms of continuous increase in optical density, although the growth provided by BG-11 was significantly higher than the 0.11–0.57% dilutions (P < 0.05). After 16 days of monitoring, the OD 750 values for the 2.29–5.71% dilutions were not significantly different (P < 0.05) and the three curves were approaching the same point, regardless of the significant differences in the initial OD 750 readings amongst these three dilutions. However, after 36 days of monitoring, the 2.29% dilution had the highest OD 750, which was significantly higher than any other dilution (supernatant or filtered) except the 4.57% supernatant. Considering the lower initial OD 750 reading, the 2.29% may be considered the optimum dilution for the supernatant, despite the insignificant differences between the 2.29% and 4.57% curves by the end of the monitoring period.
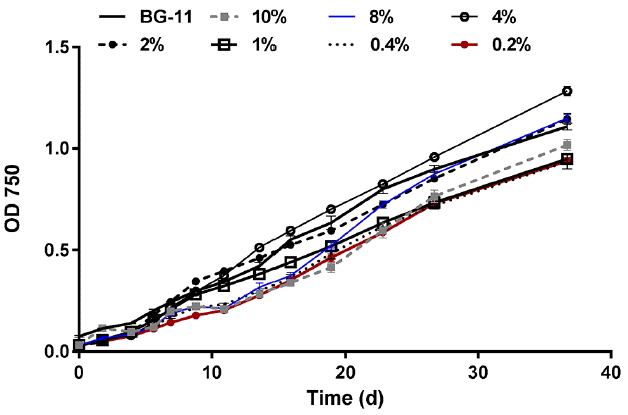
For the filtered digestate cultures, the 4% dilution achieved the highest biomass concentration expressed as OD 750 as of day 16 followed by BG-11, 2%, and 1% dilutions, respectively (Fig. 10). In summary, it appears that a nitrogen concentration of 100 mg N/L (7.3 mM) provided the optimum growth for both categories (supernatant and filtered). However, the higher optical density observed in the supernatant dilution may be due to the initial turbidity of the supernatant media compared to the filtered media. Nitrogen form may have contributed to the differences among the two categories; since nitrogen exists entirely as ammonia in the filtered digestate, whereas both ammonia and organic nitrogen exist in the supernatant. Li et al. [6] indicated that nitrate is the favorable nitrogen form to the microalga N. oleoabundans followed by urea and ammonium. Moreover, they compared 3, 5, 10, 15, and 20 mM nitrate concentrations and concluded that the optimum nitrate concentration for cell growth was 10 mM while 5 mM was optimum for high lipid production. They also suggested that 15 mM or higher may inhibit cell growth [6]. Even though our testing configuration differs from that used by Li et al. [6], the suggested optimum dilution is well within the range of 5–10 mM for optimum biomass and lipid productivities. Levine et al. [3] obtained similar results when they observed a significantly better growth with nitrate compared to ammonium. In fact, they indicated that high ammonium concentrations may cause growth inhibition, but the toxic effects could be reduced by following a fed-batch or continuous flow patterns; thus, reducing the initial inhibition [3]. On the other hand, Tam and Wong [17] indicated that microalgae in general prefer ammonium over nitrate or organic nitrogen, especially under continuous cultivation conditions. Tam and Wong [19] revealed that 20–250 mg N/L ammonia concentrations did not inhibit the growth of Chlorella vulgaris. Additionally, pH affects the inhibition due to ammonia elevated concentrations. At pH values less than 8, nitrogen exists mostly in the non-toxic ammonium form as opposed to the toxic ammonia which exists under alkaline conditions [19]. Park et al. [20] reported that the microalga Scenedesmus accuminatus experienced inhibition at ammonium concentration up to 100 mg NH4-N/L. 200 mg NH4-N/L or higher resulted in decreasing the final biomass concentration, but the inhibition became severe with an increase to 1000 mg NH4-N/L [20]. Wang and Lan [14] found that the microalga N. oleoabundans consumed ammonium faster than nitrate, and they hypothesized that ammonium is the preferred nitrogen form for this microalga. In our experiment, the highest ammonia concentration was 249 mg N/L for the filtered 10% dilution. At this dilution, the biomass concentration as expressed by OD 750 was relatively low in the early stages, and in fact it was the lowest after around 23 d. After that, the growth increased and towards the end of the monitoring period, the OD 750 of the 10% filtered exceeded the 1%, 0.4%, and 0.2% filtered cultures. As a result, there was no clear sign of ammonia inhibition at the concentrations tested; however, the growth at high ammonia concentrations appeared to be slower in the early stages.
There were several attempts to scale-up the cultivation of the microalga N. oleoabundans in a 100-L raceway pond by using the 2.29% AD supernatant as a nutrient medium. However, it has been observed that the culture was not purely N. oleoabundans, as Scenedesmus sp. and cyanobacteria cells were identified within the culture. Filtering of the invasive species was attempted to maintain a unialgal culture using filter bags with opening sizes of 10 and 5 μm. This technique was effective in removing cyanobacteria cells; however, Scenedesmus sp. cells were still dominant in the 5 μm filtrate. This was attempted several times; however, due to the relatively long cultivation period, other species grew in addition to N. oleoabundans.
Closed photobioreactors generally have the advantage of less contamination risks and easier contamination control when compared to open systems [36]. While widely used for the cultivation of high oil content microalgae, open ponds susceptibility to contaminants invasion such as bacteria, viruses, and other algae may limit their applicability on a commercial scale [36, 37]. Some of the practices suggested in the literature to mitigate microalgal culture contamination include growing species that have been identified with less contamination risk when cultivated outdoor even for longer periods due to their tolerance to extreme conditions such as high alkalinity or salinity. These species include Dunaliella, Chlorella, Spirulina, and Arthrospira [37, 38]. Menetrez [37] indicated that genetically modified algae may become a method to limit contamination. Moreover, allowing native invasive species that are acclimated to the local conditions to take over and grow instead can reduce the contamination concerns [38, 39]. Consequently, closed photobioreactors might be more suitable for the cultivation of the microalga N. oleoabundans. Future growth experiments in the raceway ponds will employ Scenedesmus sp. under shorter cultivation periods as maintaining a unialgal culture in the open system for multiple weeks is extremely difficult. This will reduce the likelihood that other invasive species such as cyanobacteria will have time to dominate the ecosystem [36, 38]. Finally, subjecting the culture to extreme conditions in temperature, light, or pH may favor the growth of the target microalgae strain if it is tolerant to these extreme conditions [36].
4. Conclusions
In this study, several pretreatment methods were applied to the anaerobic digestate from two sources. These pretreatment methods included hydrogen peroxide oxidation, filtration, and supernatant extraction. It was found that diluting the digestate and allowing it to settle for a certain time resulted in decreasing the COD as well as the turbidity in the supernatant. However, N/P ratio increased in the supernatant; as the reduction of phosphorus was considerably higher than nitrogen. Finally, the microalga N. oleoabundans was cultivated using diluted anaerobic digestate supernatant and filtrate. It was found that the supernatant provided slightly better growth compared to the filtered media, which is thought to be due to the high ammonia concentrations in the filtered digestate. Moreover, the 2.29% diluted supernatant, which is equivalent to a total nitrogen concentration of 100 mg N/L, appeared to provide the optimum growth of the microalga N. oleoabundans. It was attempted to scale up the microalgae cultivation to a raceway pond, but the culture was invaded by other microalgae species. Several attempts were made in order to eliminate the contamination and maintain a unialgal culture, but the extended cultivation time allowed other species to prevail.
In general, the combination of anaerobic digestion and microalgae cultivation is an attractive solution for biofuels production. The former produces biogas while decreasing the COD of the waste, and generates digestate that is rich with nutrients. This digestate is widely used as a fertilizer but it was proven that it can support the growth of microalgae. Moreover, combining the two processes has other promising potentials such as scrubbing the carbon dioxide from the biogas using the microalgae and the anaerobic digestion of the microalgae biomass to produce biogas.