1. Introduction
Total organic carbon (TOC) is one of the representative measurement parameters of organic pollutants in surface water quality besides biological oxygen demand (BOD5) or chemical oxygen demand (COD), which is simultaneously able to measure particulate organic carbon (POC) as well as dissolved organic carbon (DOC) [1, 2]. Generally, it is reported that the ratio between DOC and TOC ranged widely according to regions that ranged from 0.1 to 0.9 with average of 0.6 in rivers [1–3]. In addition, recent studies have reported the good relation between non-biodegradable organic pollutants such as pharmaceutically active compounds (PhACs) and TOC as well as between BOD5 or COD and TOC in case of rivers and wastewater [4–11]. Based on these reports, TOC is recently highlighted as an alternative water quality index of organic pollutants instead of BOD5 or COD [4, 5].
The natural concentration of TOC in surface water is strongly related with soil erosion that is the one of natural geological phenomenon, which can directly influence on the surface water quality in upstream as well as downstream by released soil organic matters based on the effects of seasonal and regional characteristics [2, 12]. According to some studies about exporting organic carbon from soils, POC and DOC are influenced by climatic or regional characteristics and geological processes such as soil erosion, which can accelerate the budgets of organic carbon into surface water [3, 12]. In addition, it is reported that the discharges of TOC are strongly influenced by seasonal and regional characteristics. The wet season increased the budgets of organic carbons 5–11 times higher than other seasons. Moreover, various topography conditions such as vegetation cover also play an important key role on discharging soil organic carbon from soil to surface water [13]. Therefore, it is apparent that investigation on the distribution of TOC in undisturbed natural upstream would provide understanding about the natural loads of organic pollutants from watersheds that could be used for the evaluation, determination and improvement of target surface water quality in specific watersheds. Unfortunately, little information has been known about the distribution of TOC in upstream of river even though the initial inputs of organic carbon begin from upstream areas.
The objective of this study is to investigate the variation of TOC at undisturbed upstream sites and national water quality monitoring sites according to spatial and seasonal characteristics in four major rivers in Korea. Thus, it would provide unique water quality data for organic carbon levels between top areas and down areas in four major rivers.
2. Materials and Methods
2.1. The Profiles of Study Sites
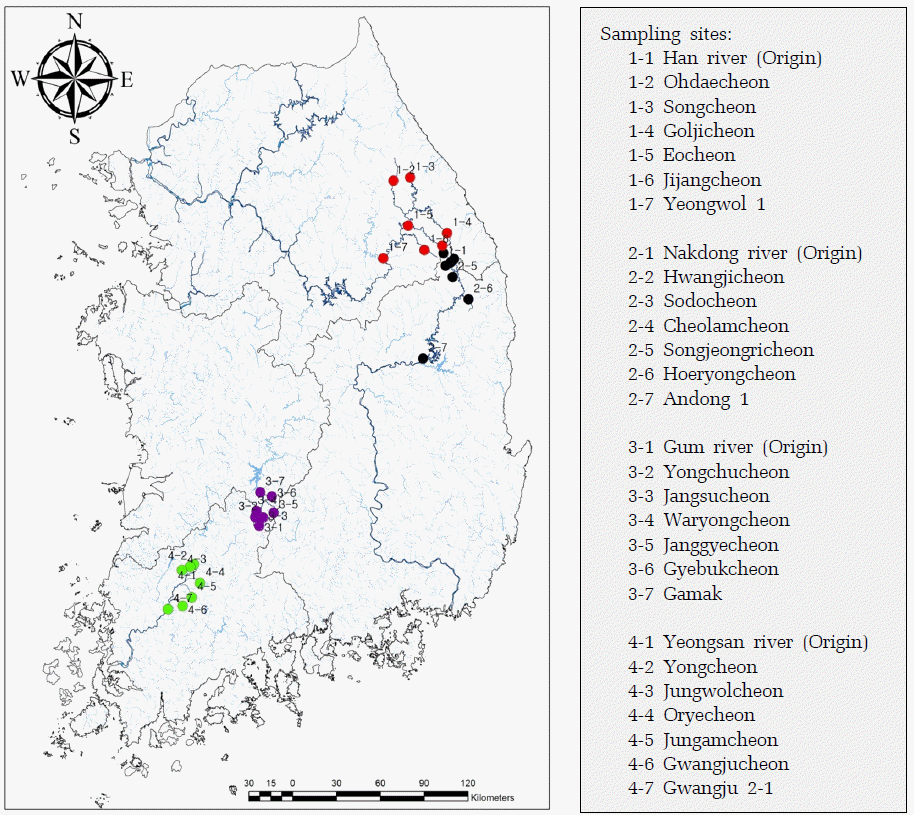
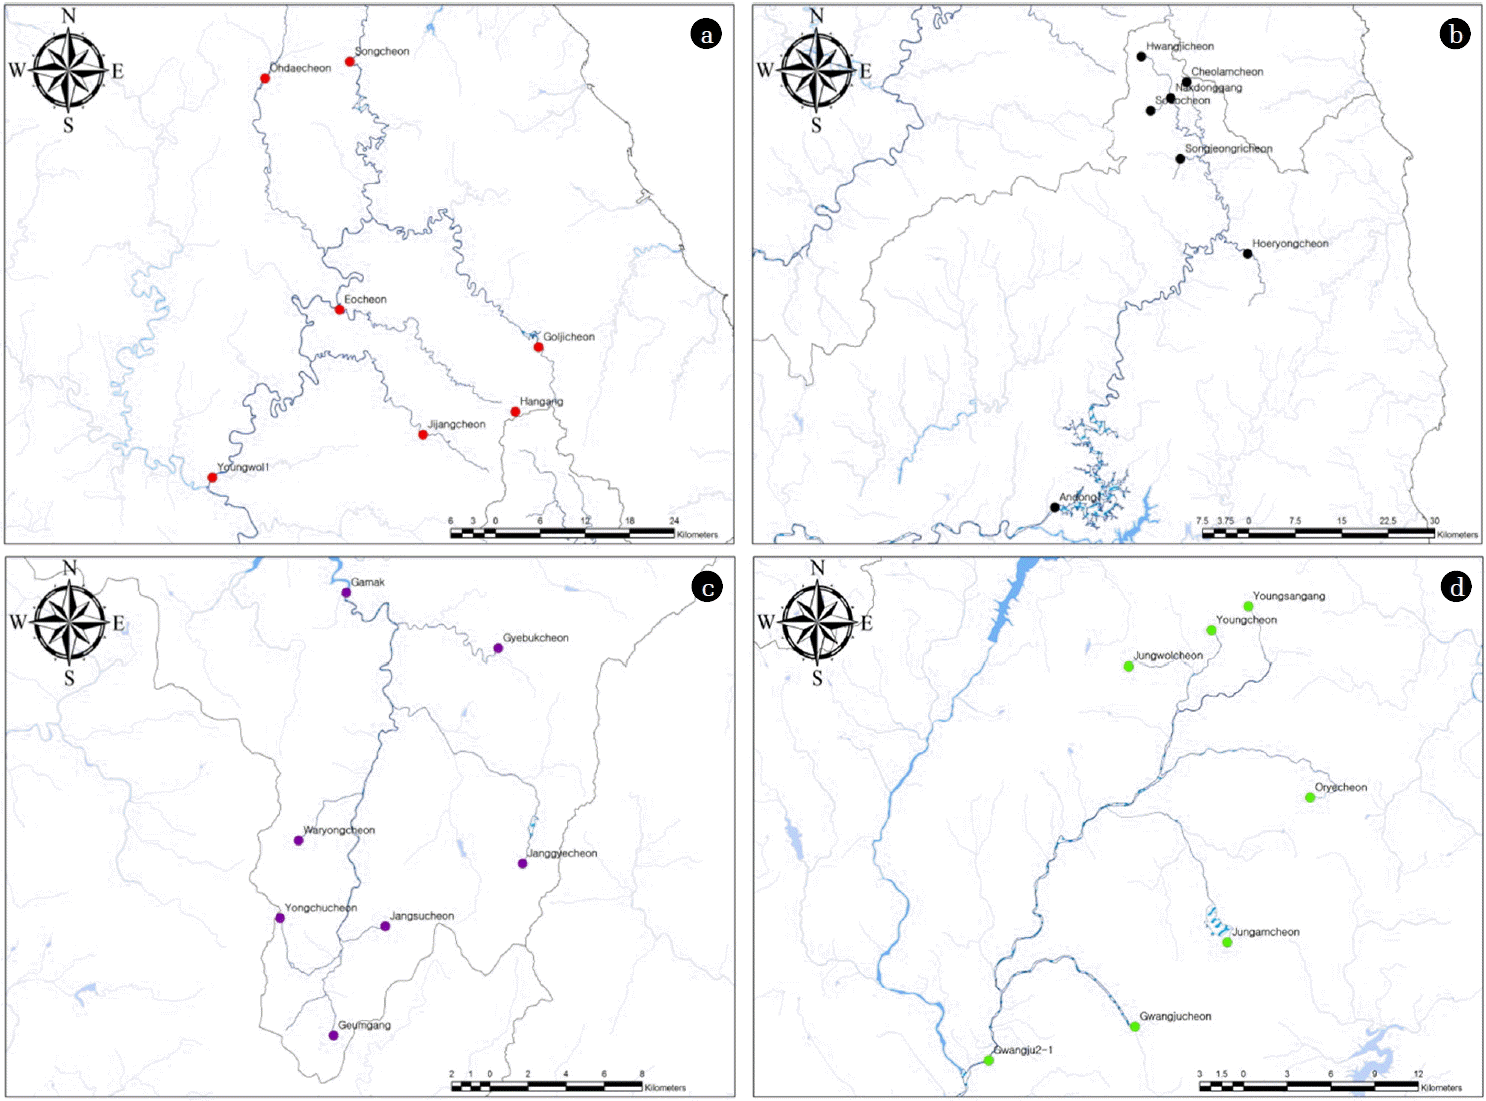
To investigate the distribution of TOC at undisturbed upstream sites, we selected 24 sampling sites where are located in upstream of four major rivers that each major river is consisted with six upstream sampling sites from 1 to 6 (Fig. 1). Here, we selected the undisturbed upstream sites from 1 to 6 at each major river that those sites are regarded as the suitable sites having no significant sources of anthropogenic organic pollution into streams because they are located above the each river. Particularly, the sites of 1-1, 2-1, 3-1 and 4-1 are the origin site of Han river, Nakdong river, Geum river and Yeongsan river, respectively, thus they may represent the original undisturbed water quality at each river. In addition, the TOC concentration at the national water quality monitoring sites of 1-7, 2-7, 3-7 and 4-7 for Han river, Nakdong river, Geum river and Yeongsan river, respectively is simultaneously investigated in order to compare to the TOC between upstream and downstream in four major rivers. Fig. 2 showed locations in detail about the six undisturbed upstream sampling sites as well as one national water quality monitoring site for each major river.
2.2. Analysis and Collection of Water Samples
Water samples for seven sites in each watershed were taken once on April, July, September, and November during 2012 and the water samples were analyzed with TOC, BOD5 and COD. All samples were carefully carried by ice storage container and stored at 4°C if samples were not immediately analyzed. TOC (ES 04311.1b), BOD5 (ES 04305.1b) and COD (ES 04315.1a) were analyzed according to the national water standard methods in Korea [14]. For the data of national water quality monitoring sites during 2008 – 2012, it is obtained from Water Information System (WIS) in National Institute of Environmental Research (NIER, http://water.nier.go.kr) that are Yeongwol 1 for Han river, Andong 1 for Nakdong river, Gamak for Geum river and Gwangju 2-1 for Yeongsan river.
3. Results and Discussion
3.1. Distribution of TOC in Upstream Sites
To investigate the distribution of TOC in upstream sites at each river, we choose six undisturbed upstream sites that are located in the uppermost area at each river (Fig. 1). The average TOC concentration of 1-1, 2-1, 3-1 and 4-1 that stems of each major river showed 0.63 mg/L, 0.50 mg/L, 0.72 mg/L and 0.76 mg/L in Han river, Nakdong river, Geum river and Yeongsan river, respectively (Table 1). For the TOC concentration at origin site of each river, the origin site of Nakdong river (2-1) showed the lowest TOC concentration, while the origin site of Yeongsan river (4-1) showed the highest TOC concentration. In addition, the average concentration of TOC at six upstream sites in each river showed 0.67 mg/L, 0.66 mg/L, 0.76 mg/L and 0.91 mg/L in Han river, Nakdong river, Geum river and Yeongsan river, respectively. For the results of average TOC concentration for six upstream sites, Nakdong river showed the lowest TOC concentration, while Yeongsan river showed the highest TOC concentration. From the results of TOC in upstream sites, the variation of TOC may be related with regional features such as topography conditions that provide functional relationships between the structural features of the regional ecosystems and water quality [15, 16]. Among regional features, the soil erosion is the one of important features to deliver soil organic matters into water by nature processes such as raindrop, runoff, wind and gravity [12]. A study demonstrated that several effects such as topography, soil factors, local water quality management and geology have influenced on the water quality in Han river in Korea, which resulted in the spatial distribution of water quality [17]. In addition, a recent study demonstrated that soil erosion plays a critical role on the water quality in Korean watersheds [18]. From these studies, we can assume that the distribution of TOC in upstream sites is strongly influenced by surrounding land surface features regionally. Due to the different topography conditions in each watershed, we observed the variation of TOC at undisturbed sites in each river that ranged from 0.49 mg/L to 0.90 mg/L in Han river, from 0.50 mg/L to 0.96 mg/L in Nakdong river, from 0.57 mg/L to 0.86 mg/L in Geum river, and from 0.71 mg/L to 1.37 mg/L in Yeongsan river (Table 1). These results showed the regionally significant variation of TOC at each river that the lowest concentration of TOC was observed in Han river, while the highest concentration of TOC was observed in Yeongsan river. According to the seasonal features on TOC variation for upstream sites in four major rivers, wet season between April and August showed slightly higher TOC concentration comparing to the TOC concentration in dry season between September and November for six upstream sites of each river. The average concentration of TOC between wet season and dry season were 0.77 mg/L and 0.56 mg/L in Han river, 0.69 mg/L and 0.63 mg/L in Nakdong river, 0.80 mg/L and 0.73 mg/L in Geum river and 1.21 mg/L and 0.68 mg/L in Yeongsan river. Regarding to the seasonal variation of TOC concentration, previous studies support that the main factor on influencing the variation of TOC between wet season and dry season is runoff by rainfall that would affect on the temporal and spatial TOC variation in rivers [1, 13]. Moreover, it is reported that the variation of TOC in spring season is several times higher than other season in rivers due to the increases of runoff by rainfall [13]. Especially, the average annual rainfall demonstrated that the largest precipitation belongs to the wet season from April to August in Korea and it is reported that Korea has the biggest variability of annual rainfall in the world [19]. Therefore, the variation of TOC at wet season could be explained by the seasonal effect in addition to the regional effect, which is in agreement with previous studies about the rainfall pattern in Korea. However, the regional effect is more likely to influence on the large variation of TOC concentration in upstream sites.
3.2. Distribution of TOC in National Water Quality Monitoring Sites
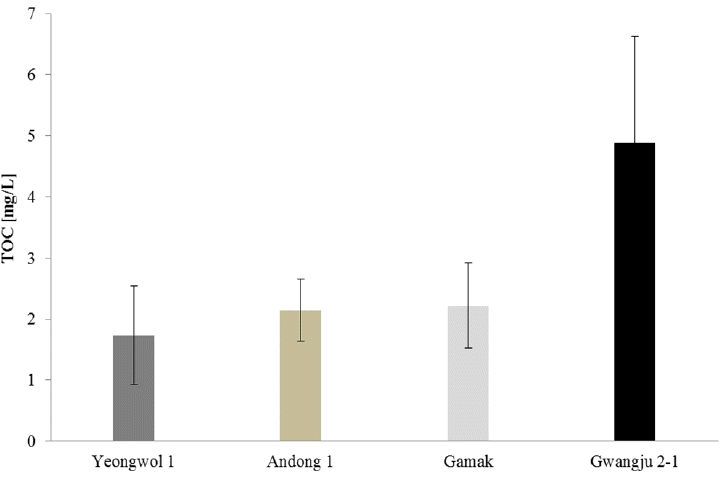
In our studies, we choose four national water quality monitoring sites that are Yeongwol 1 for Han river, Andong 1 for Nakdong river, Gamak for Geum river and Gwangju 2-1 for Yeongsan river (Fig. 1 and Fig. 2). The average concentration of TOC for four national water quality monitoring sites showed that the lowest average TOC concentration was 1.58 mg/L in Yeongwol 1 and the highest average TOC concentration was 3.37 mg/L in Gwangju 2-1. Additionally, Andong 1 and Gamak showed 1.88 mg/L and 1.80 mg/L TOC, respectively (Table 1). Similar with the results of upstream sites, the results of TOC in four national water quality monitoring sites also showed that the highest average concentration of TOC happened in wet season between April and August comparing to the concentration of TOC in dry season between September and November. These results demonstrate that the concentration of TOC in four national water quality monitoring sites has particularly been influenced by rainfall event in wet season. According to the annual report from Metrological office of Korea, the total annual rainfall was 1,479.1 mm in 2012 and the 69% of total annual rainfall happened between spring and summer season. The rainfall data can support our results that higher concentration of TOC is likely related with rainfall event in wet season. Moreover, Fig. 3 shows the average concentration distribution of TOC in four national water quality monitoring sites during 5 years from 2008 to 2012 that presents the significant regional difference on the TOC. According to the results of TOC in Fig. 3, the lowest concentration of TOC is 1.82 mg/L in Yeongwol 1 for Han river, while the highest concentration of TOC is 4.89 mg/L in Gwangju 2-1 for Yeongsan river. Andong 1 for Nakdong river and Gamak for Geum river show 2.15 mg/L and 2.22 mg/L TOC, respectively. The results show the similar trends of TOC in our results. Particularly, the concentration of TOC in national water quality monitoring sites was significantly higher than the concentration of TOC in upstream sites that showed the opposite results from previous study that investigated the concentration levels of nutrients at undeveloped streams and rivers in U.S.A. [20]. They reported that organic nutrients would be decreased by increasing water basin due to loss processes via stream channels [20], however we observed the concentration of TOC in the national water quality monitoring sites is higher than the concentration of TOC in upstream sites at each river (Table 1). Particularly, the sites of 1-7, 3-7 and 4-7 could be influenced by anthropogenic carbon sources due to the existence of urban, agricultural and industrial region around the sites that may result in higher TOC concentration than the TOC concentration in upstream sites each river. Therefore, our results are in the same agreement with previous study that showed the effects of urban and agricultural lands on the major contributor of TOC in water environment [21]. Interestingly, we observed that the high concentration of TOC at the site of 2-7 for national water quality monitoring in Nakdong river even though there are no significant anthropogenic carbon sources around the site. The result is likely to reflect the effects of naturally originated organic carbon sources on the high concentration of TOC in the absence of organic carbon sources. Similarly, recent study demonstrated the effect of photosynthesis on the major contributor of TOC in streams and particularly forests is reported by the one of major contributors among the terrestrial sources [21]. Therefore, the high concentration of TOC at the site of 2-7 may be associated with the natural forest organic carbon, however it requires further studies to understand what factors cause the high concentration of TOC in the absence of anthropogenic pollutant sources.
3.3. Distribution of BOD5 and COD
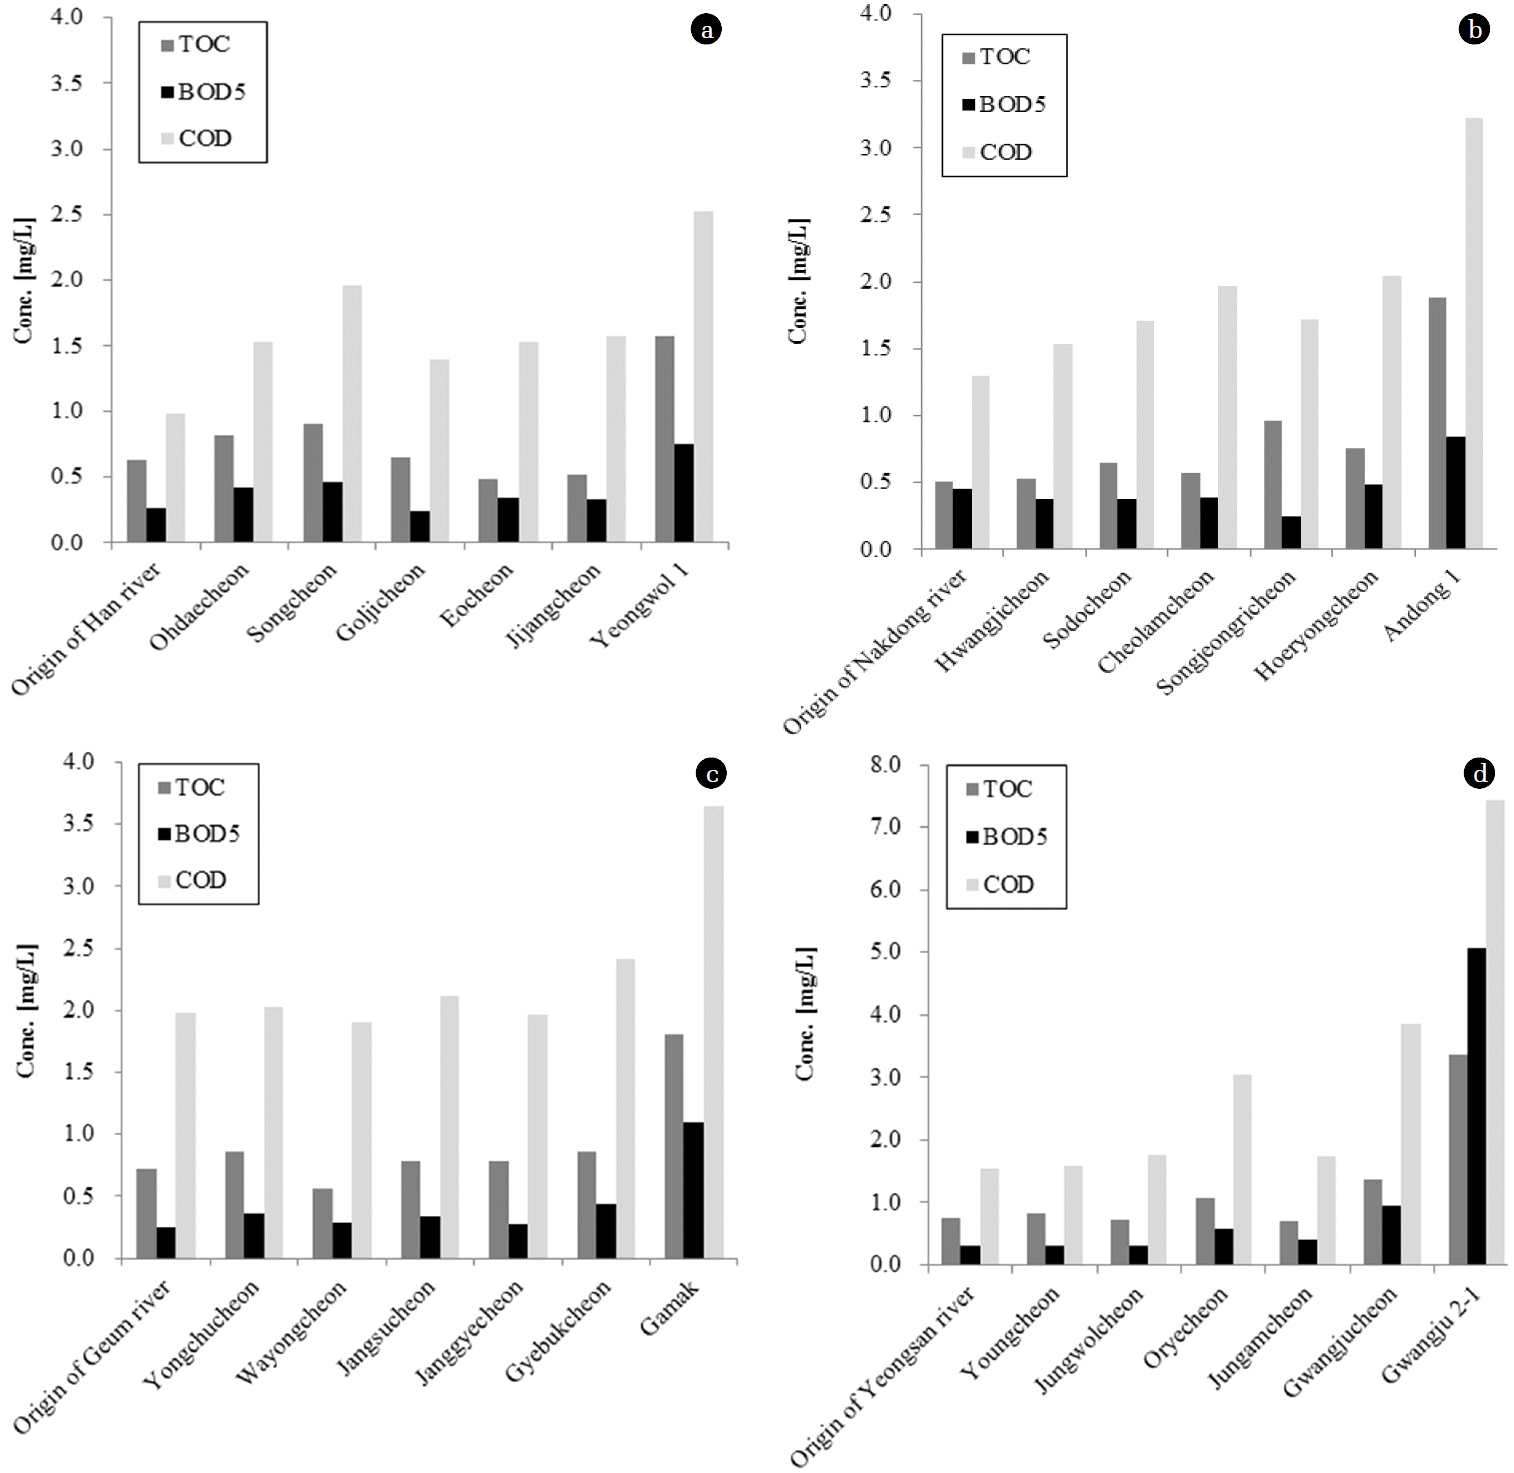
In addition to TOC analysis, we examined biological oxygen demand (BOD5) and chemical oxygen demand (COD) in our study. The average concentration in six upstream sites in each river ranged from 0.25 mg/L to 0. 46 mg/L BOD5 and from 0.98 mg/L to 1.96 mg/L COD in Han river, from 0.25 mg/L to 0.49 mg/L BOD5 and from 1.30 to 2.04 mg/L COD in Nakdong river, from 0.25 mg/L to 0.44 mg/L BOD5 and from 1.91 mg/L to 2.41 mg/L COD in Geum river, from 0.30 mg/L to 0.94 mg/L BOD5 and from 1.54 mg/L to 3.85 mg/L COD in Yeongsan river (Fig. 4). For the four national water quality monitoring sites, the average concentration was 0.75 mg/L BOD5 and 2.53 mg/L COD in Yeongwol 1, 0.84 mg/L BOD5 and 3.23 COD mg/L in Andong 1, 1.10 mg/L BOD5 and 3.65 COD mg/L in Gamak and 5.06 mg/L BOD5 and 7.43 COD mg/L in Gwangju 2-1 (Fig. 4). The lowest concentration on both BOD5 and COD was observed in Han river, whereas Yeongsan river showed the highest concentration on both BOD5 and COD. These results showed the similar pattern with the results of TOC concentration. Particularly, Fig. 4 showed the results of BOD5 and COD in detail with TOC analysis. In most of cases, COD showed the highest levels, while BOD5 showed the lowest levels. The concentration of TOC was ranged between BOD5 and COD that means TOC is moderate variability between two water parameters. These results are likely to imply that TOC may be a good parameter for organic pollutants that is an agreement with previous study in case of microorganism-mediated oxidation in surface waters [22].
3.4. Implication of TOC Distribution in Upstream
The results about the variation of TOC at upstream sites located in four major rivers would provide the regional reference organic carbon levels. Particularly, total maximum daily loads (TMDLs) have been applied extensively on four major rivers since 2004 by the Ministry of Environment in order to regulate organic pollutants generated in watersheds by establishing the maximum pollutant limits of organic pollutants. As a result of TMDLs regulation, the management of organic pollutants has been issued to achieve the allowable total organic loads at watersheds in four major rivers. Therefore, it is necessary to investigate the concentration of organic pollutants at upstream as well as downstream prior to establish the target water quality in watershed because the works would provide fundamental water quality data for TMDLs. However, monitoring data at the end point of each watershed have been only used for the TMDLs regulation and water quality data on upstream have just considered on the establishment of TMDLs temporarily for the basic data of water quality model [23]. From this view, the natural distribution of TOC at upstream sites in four major rivers would provide meaningful information for the purpose of establishment on TMDLs in a specific watershed in the future as well as the reference organic carbon levels in four major rivers in Korea.
4. Conclusions
We investigated the distribution of TOC at six upstream sites in each major river and the average concentration of TOC ranged from 0.49 mg/L to 0.90 mg/L in Han river, from 0.50 mg/L to 0.96 mg/L in Nakdong river, from 0.57 mg/L to 0.86 mg/L in Geum river and from 0.71 mg/L to 1.37 mg/L in Yeongsan river. In case of four national water quality monitoring sites in each major river, the average concentration of TOC was 1.58 mg/L in Yeongwol 1 for Han river, 1.88 mg/L in Andong 1 for Nakdong river, 1.80 mg/L in Gamak for Geum river, and 3.37 mg/L in Gwangju 2-1 for Yeongsan river that is significantly higher than the average concentration of TOC in upstream sites at each river. These results implied that the variation of TOC in upstream sites and national water quality monitoring sites at each river is influenced by seasonal and spatial characteristics.