AbstractThe aim of this study was to examine the phosphate (P) removal by quintinite from aqueous solutions. Batch experiments were performed to examine the effects of reaction time, temperature, initial phosphate concentration, initial solution pH and stream water on the phosphate adsorption to quintinite. Kinetic, thermodynamic and equilibrium isotherm models were used to analyze the experimental data. Results showed that the maximum P adsorption capacity was 4.77 mgP/g under given conditions (initial P concentration = 2–20 mgP/L; adsorbent dose = 1.2 g/L; reaction time = 4 hr). Kinetic model analysis showed that the pseudo second-order model was the most suitable for describing the kinetic data. Thermodynamic analysis indicated that phosphate sorption to quintinite increased with increasing temperature from 15 to 45°C, indicating the spontaneous and endothermic nature of sorption process (ΔH0=487.08 kJ/mol; ΔS0=1,696.12 J/(K·mol); ΔG0= −1.67 to −52.56 kJ/mol). Equilibrium isotherm analysis demonstrated that both Freundlich and Redlich-Peterson models were suitable for describing the equilibrium data. In the pH experiments, the phosphate adsorption to quintinite was not varied at pH 3.0–7.1 (1.50–1.55 mgP/g) but decreased considerably at a highly alkaline solution (0.70 mgP/g at pH 11.0). Results also indicated that under given conditions (initial P concentration=2 mgP/L; adsorbent dose=0.8 g/L; reaction time=4 hr), phosphate removal in the stream water (1.88 mgP/g) was lower than that in the synthetic solution (2.07 mgP/g), possibly due to the presence of anions such as (bi)carbonate and sulfate in the stream water.
1. IntroductionAn algal bloom is a widespread environmental problem around the world, posing a great threat to aquatic environments and drinking water treatment facilities. When an excessive amount of phosphorus exists in aquatic environments, it causes eutrophication in water bodies, leading to a rapid accumulation of algal population in lakes, reservoirs, and coastal waters [1]. Various methods including chemical, biological, and membrane technologies have been applied to reduce the phosphorus concentration in wastewater before its discharge [2]. Among them, adsorption is widely used for the removal of phosphorus mainly because of cost-effectiveness and simplicity of operation [3].
Quintinite is a carbonate mineral with hexagonal crystal system. It has a chemical formula of Mg4Al2(OH)12CO3·3H2O, which is included in the family of hydrotalcite-like (HTL) particles [4]. Hydrotalcite is a carbonate mineral and rare in nature with a general formula of Mg6Al2(CO3)(OH)16·4(H2O). Hydrotalcite mineral is a layered double hydroxide (LDH) with carbonate anions lying between the structural layers [5]. The HTL particles are similar to hydrotalcite mineral, which can be easily synthesized in the laboratory. They consist of positively charged brucite-like layers and negatively-charged interlayers. They are a class of anionic clays with high surface area and large anion exchange capacity [6]. The HTL particles have been used as adsorbents for the removal of oxyanions including chromate, phosphate, nitrate, borate, arsenate/arsenite, selenite/selenite, etc. [7]. Very few researchers have used calcined quintinite for the removal of inorganic contaminants (fluoride, arsenate and nitrate) [4] and organic contaminants (phenol and 4-nitrophenol) [8]. Also, studies related to the phosphate removal by quintinite from aqueous solutions are scarce.
The aim of this study was to examine the removal of phosphate by quintinite from aqueous solutions. Batch experiments were performed to examine the effects of reaction time, temperature, initial phosphate concentration, and initial solution pH on the adsorption of phosphate to quintinite. Additional batch experiments were conducted to compare the phosphate removal in synthetic water and real stream water. Kinetic, equilibrium isotherm and thermodynamic models were used to analyze the batch experimental data.
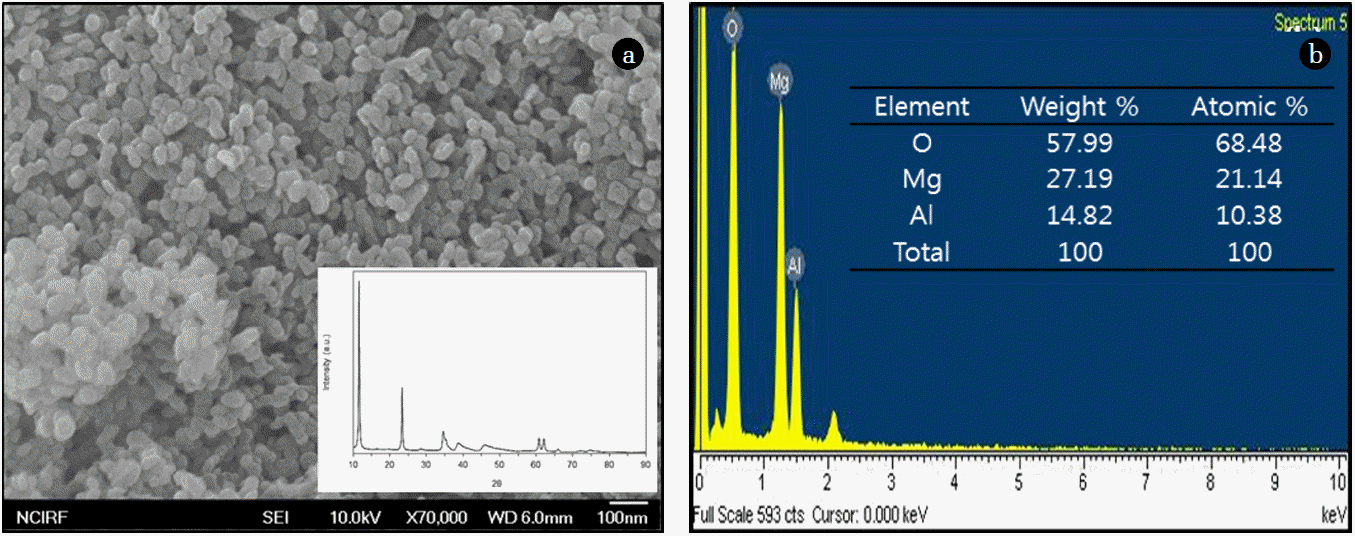
2. Materials and Methods2.1. Synthesis of QuintiniteQuintinite was prepared by the following procedures described in detail elsewhere [9]. Briefly, the particles were synthesized by co-precipitating mixtures of magnesium nitrate [Mg(NO3)2·6H2O] and aluminum nitrate [Al(NO3)3·9H2O] in alkali solution (pH= 13) consisting of sodium hydroxide (NaOH) and sodium carbonate (Na2CO3). The synthetic particles were nano-sized (Fig. 1(a)), having a layered structure with sharp and intense lines at low 2θ and less intense lines at high 2θ (inset of Fig. 1(a)). Energy dispersive X-ray spectrometer (EDS) analysis was also performed using the FESEM. The EDS pattern (Fig. 1(b)) demonstrates that magnesium (Mg) and aluminum (Al) were the major elements of the particles. The atomic weight percents of Mg and Al were 21.14% and 10.38%, respectively. In the EDS analysis, Mg was evident at the peak position of 1.254 keV as K alpha X-ray signal, while Al was found at the peak position of 1.485 keV as K alpha X-ray signal (Fig. 1(b)). According to N2 adsorption-desorption analysis, the particles had a specific surface area of 49.8 m2/g, total pore volume of 0.4582 cm3/g and mesopore volume of 0.4522 cm3/g.
2.2. Batch ExperimentsPhosphate removal by the quintinite was conducted under batch conditions. The desired phosphate (P) solution was prepared by diluting the stock solution (1,000 mgP/L) that had been made from potassium dichromate (KH2PO4). The batch experiments were performed at 30°C using 50 mL polypropylene conical tubes, unless otherwise stated. All of the batch experiments were performed in triplicate. The first set of experiments was performed as a function of reaction time (adsorbent dose=1.2 g/L; initial P concentration= 2 mgP/L). The tubes were shaken at 100 rpm using a shaking incubator (Daihan Science, Seoul, Korea). After 24 hr, the samples were collected and filtered through a 0.45-μm membrane filter. The phosphate concentration was analyzed by the ascorbic acid method [10]. The phosphate concentrations were measured at a wavelength of 880 nm using a UV–vis spectrophotometer (Helios; Thermo Scientific, USA). The additional experiments were performed at 15 and 45°C to examine the effect of temperature on phosphate removal.
The second set of experiments was conducted as a function of the initial P concentration. Quintinite particles (1.2 g/L) were added to 30 mL of phosphate solution (initial concentration = 2–20 mgP/L), and the samples were collected 4 hr later. The third set of experiments examined phosphate removal as a function of initial solution pH (adsorbent dose = 1.2 g/L; initial P concentration = 2 mgP/L); 0.1 M NaOH and 0.1 M HCl solutions were used to adjust the pH of the reaction solution from 2.0 to 11.0, and the pH was measured by a pH probe (9107BN; Thermo Scientific, USA).
The fourth set of experiments performed to compare the phosphate removal in synthetic water solution and real stream water sample. Synthetic water solutions were prepared using deionized water in the laboratory, whereas real water samples were collected from the Seoho stream located in Suwon, Korea. The ionic composition of the stream water was analyzed using ion chromatograph (ICS-3000; Dionex, USA), and chemical oxygen demand (CODcr) was measured according to standard method [10]. The stream water had the following composition: NaCl=2.41 mM, NaHCO3= 0.38 mM, Ca(HCO3)2=0.67 mM, CaSO4=0.17 mM, MgSO4=0.20 mM, Mg(NO3)2 =0.03 mM, KNO3 =0.32 mM, K2HPO4=1.77×10⁻⁴ mM, COD=4.2 mg/L, pH=6.9, IS=613 μS/cm. The experiments were conducted at an initial P concentration of 2 mgP/L with an adsorbent dose of 0.8 g/L in 30 mL of solution. In the case of the stream water sample, which had a very low phosphate concentration (0.017 mgP/L), phosphate was added to meet the initial P concentration of 2 mgP/L.
2.3. Model AnalysesThe experimental data from the first set of experiments (reaction time data) were analyzed with the pseudo first-order (Eq. (1)), pseudo second-order (Eq. (2)) and Elovich (Eq. (3)) kinetic models [11]:
where qt is the amount of P adsorbed at time t, qe is the amount of P adsorbed at equilibrium, k1 is the pseudo first-order rate constant, k2 is the pseudo second-order rate constant, α is the initial adsorption rate constant and β is the Elovich adsorption constant.
The experimental data from the first set of experiments (different temperature data) were also analyzed to determine the thermodynamic parameters using the following relationships [12]:
where ΔG0 is the change in Gibb’s free energy, ΔS0 is the change in entropy, ΔH0 is the change in enthalpy, R is the gas constant, Ke is the equilibrium constant (dimensionless), and a is the adsorbent dose (g/L). ΔS0 and ΔH0 were calculated by plotting ln (Ke) versus 1/T using Eq. (6), whereas ΔG0 was determined from Eq. (4).
The experimental data from the second set of experiments (initial P concentration) were analyzed using the Freundlich (Eq. (7)), Langmuir (Eq. (8)) and Redlich-Peterson (Eq. (9)) isotherm models [13]:
where KF is the Freundlich constant related to the adsorption capacity, Ce is the equilibrium concentration of P in the aqueous solution, 1/n is the Freundlich constant related to the adsorption intensity, Qm is the maximum adsorption capacity, KL is the Langmuir constant related to the affinity of the binding sites, KR is the Redlich-Peterson constant related to the adsorption capacity, aR is the Redlich-Peterson constant related to the affinity of the binding sites and g is the Redlich-Peterson constant related to the adsorption intensity.
All of the parameters of the models were estimated using MS Excel 2010 with the solver add-in function. The parameter values were determined by nonlinear regression. The determination coefficient (R2), chi-square coefficient (χ2) and sum of square error (SSE) were used to analyze the experimental data and confirm the fit to the model. The expressions of R2, χ2 and SSE are the followings:
where yc is the calculated adsorption capacity from the model, ye is the measured adsorption capacity from the experiment, and
is the average of the measured adsorption capacity.
3. Results and Discussion3.1. Effects of Reaction Time and TemperatureThe phosphate removal by the quintinite as a function of reaction time is provided in Fig. 2. The phosphate concentration decreased rapidly with increasing reaction time until equilibrium was reached. At 30°C, the phosphate concentration dropped to 0.124 mgP/L at 5 min of reaction time and further decreased to 0.057 mgP/L at 1 hr. The phosphate sorption reached equilibrium at 4 hr of reaction time with a phosphate concentration of < 0.05 mgP/L. The sorption capacity changed from 1.44 to 1.51 mgP/g with reaction time changing from 5 min to 4 hr.
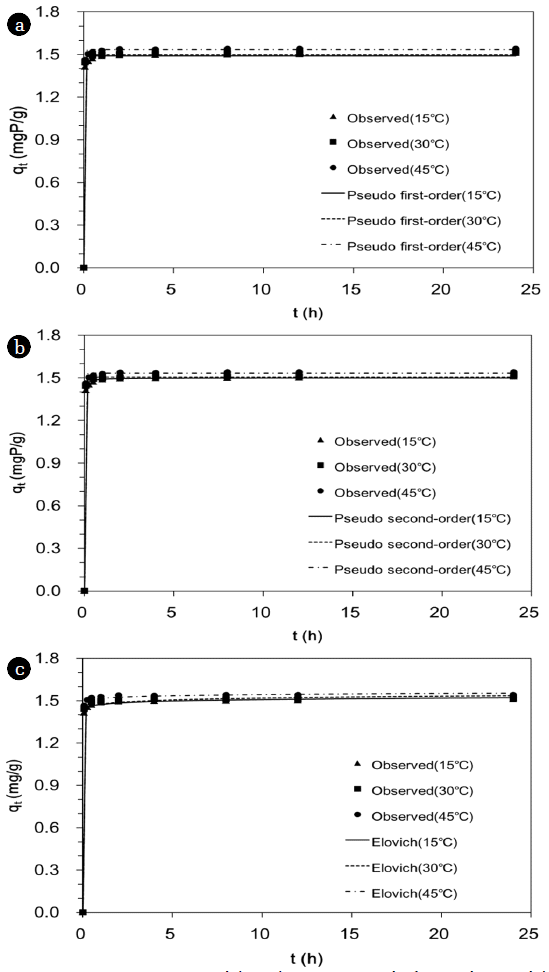
The kinetic model fits and the related model parameters are provided in Fig. 3 and Table 1, respectively. The values of R2 indicate that the pseudo second-order model (Fig. 3(b)) was the best model to describe the kinetic data, and chemisorption is involved in the adsorption of phosphate to the quintinite. In addition, the values of qe in the pseudo second-order model increased with increasing temperature (Table 1), showing that the phosphate adsorption capacity of the quintinite increased as temperature increased. The values of k2 also increased with increasing temperature, demonstrating that the time for equilibrium decreased as temperature increased.
The phosphate removal by the quintinite at different temperature is also presented in Fig. 2, demonstrating that the phosphate sorption to the quintinite increased with increasing temperature from 15 to 45°C. It indicates that the sorption process was endothermic. The thermodynamic parameters are presented in Table 2. The value of ΔH0 was determined to be 487.08 kJ/mol, demonstrating that the phosphate sorption to the quintinite had the endothermic nature. The value of ΔS0 was calculated to be 1,696.12 J/(K·mol), indicating that the randomness increased at the interface between solid and solution during the sorption process. The values of ΔG0 were in the range from −1.67 to −52.56 kJ/mol, showing that the phosphate sorption to the quintinite was spontaneous. Our results agree with the report of Halajnia et al. [14] who examined the endothermic nature of phosphate sorption to Mg/Al LDH. Cheng et al. [15] also reported that phosphate adsorption to calcined Zn/Al LDH increased with increasing temperatures from 25 to 50°C. However, Das et al. [16] reported that phosphate adsorption to calcined Mg/Al LDH decreased with increasing temperatures from 30 to 60°C, showing that the sorption process was exothermic.
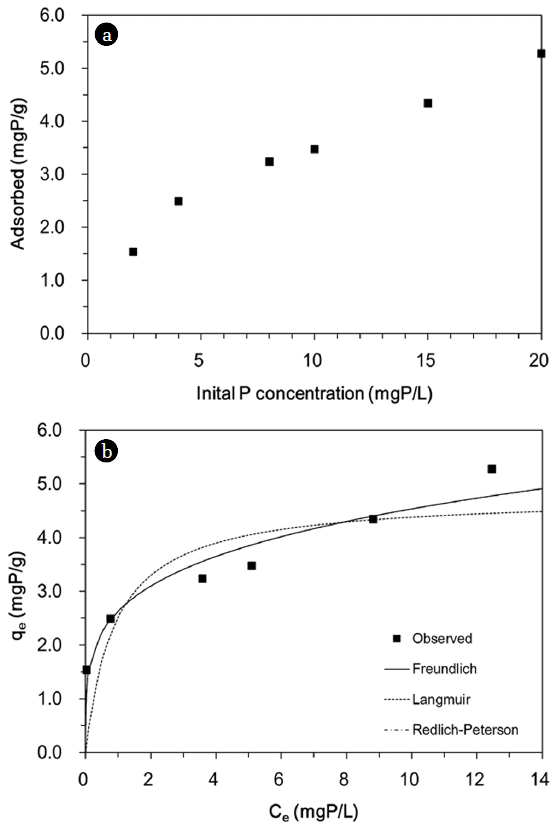
3.2. Effect of Initial Phosphate ConcentrationThe phosphate removal by quintinite particles as a function of initial phosphate concentration is provided in Fig. 4(a). The percent removal decreased with an increasing initial phosphate concentration from 2 to 20 mgP/L. At the lowest concentration of 2 mgP/L, the percent removal was 98.4%. The percent removal decreased to 45.0% at the phosphate concentration of 10 mgP/L and further decreased to 33.7% at the highest concentration of 20 mgP/L. The sorption capacity increased from 1.54 to 5.28 mgP/g with increasing phosphate concentrations from 2 to 20 mgP/L.
The equilibrium isotherm model fits and the related parameters are presented in Fig. 4(b) and Table 3, respectively. The values of R2, χ2 and SSE indicate that both the Freundlich and Redlich-Peterson isotherms were more suitable than the Langmuir isotherm at describing the equilibrium data. Note that the Redlich-Peterson model fit was superimposed on the Freundlich fit in Fig. 4(b). It is known that when aR and KR are much greater than unity, the Redlich-Peterson model can be reduced to the Freundlich model [17]. In Table 3, the value of KF from the Freundlich isotherm (= 2.63 L/g) was equivalent to the value of KR/aR from the Redlich-Peterson model, whereas the value of 1/n (= 0.24) was corresponded to the value of (1–g). The maximum phosphate adsorption capacity (Qm) was calculated to be 4.77 mgP/g from the Langmuir model, which was lower than the removal capacity for LDHs (7.3–81.6 mgP/g) reported in the literature [7]. However, it should be noted that our experiments were performed at the low initial phosphate concentration range (2–20 mgP/L).
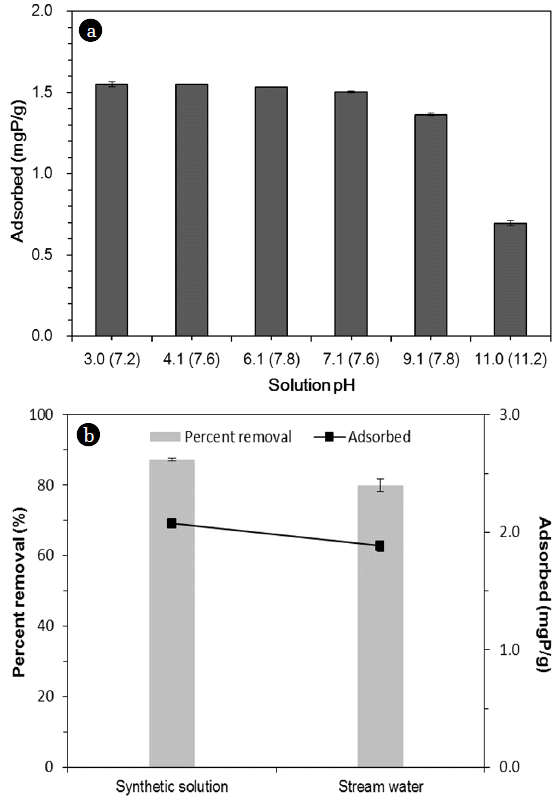
3.3. Effects of pH and Stream WaterThe effect of initial solution pH on phosphate removal by the quintinite is shown in Fig. 5(a). The sorption capacity was 1.55 mgP/g at pH 3.0. The sorption capacity remained relatively constant at 1.50–1.55 mgP/g between pH 3.0 and 7.1. At pH 9.1, the sorption capacity decreased to 1.36 mgP/g. As the pH approached 11.0, the sorption capacity decreased sharply to 0.70 mgP/g. The results indicate that phosphate removal was not much varied at initial pH 3–7. This result could be related to the fact that the final (equilibrium) pH converged to 7.2–7.8 during the sorption experiments (initial pH 3.0–7.1). Similar findings were reported in the literature by Han et al. [18] reporting that the removal of phosphate in the alginate beads containing calcined Mg/Al LDH was not sensitive to solution pH. They demonstrate that the percent removal of phosphate decreased slightly from 98.6% to 95.5% as solution pH increased from 4.9 to 8.9. In our experiments, phosphate removal decreased sharply as the solution pH approached a highly alkaline condition (pH 11.0). This could be due to the competition between phosphate ions and hydroxyl ions (OH−) to the sorption sites.
The phosphate removal in synthetic solution and stream water are compared in Fig. 5. The sorption capacity in the synthetic solution was 2.07 mgP/g with the percent removal of 87.2%, whereas the sorption capacity in the stream water was 1.88 mgP/g with the percent removal of 79.9%. The results indicate that phosphate removal in the stream water was lower than that in the synthetic solution. This result could possibly be due to the presence of anions such as (bi)carbonate (HCO32−) and sulfate (SO42−) in the stream water. Especially, (bi)carbonate could greatly interfere with the phosphate removal from the stream water [19]. It is known that two mechanisms including interlayer anion exchange and surface adsorption could contribute to the removal of phosphate by quintinite [7]. In anion exchange process, the charge balancing anions (carbonate) in the interlayer region is replaced by phosphate ions. In surface adsorption, the negatively charged phosphate ions could adsorb to the positively charged brucite-like layer through electrostatic interaction [7].
4. ConclusionsIn this study, phosphate sorption to quintinite particles was examined using batch sorption experiments. Results showed that the maximum adsorption capacity of phosphate to quintinite was 4.77 mgP/g. Kinetic model analysis showed that the pseudo second-order model was the most suitable for describing the kinetic data. Thermodynamic analysis indicated that phosphate sorption to the quintinite increased with increasing temperature from 15 to 45°C, indicating the spontaneous and endothermic nature of sorption process. Equilibrium isotherm model analysis demonstrated that both Freundlich and Redlich-Peterson models were suitable for describing the equilibrium data. In the pH experiments, the phosphate adsorption to quintinite was not varied at pH 3.0–7.1 but decreased considerably at the highly alkaline solution (pH 11.0). Results also indicated that phosphate removal in the stream water was lower than that in the synthetic solution, possibly due to the presence of anions in the stream water. This study demonstrated that quintinite could be used as an adsorbent for phosphate removal from aqueous solutions.
AcknowledgementsThis research was supported by a grant from the Korea Institute of Science and Technology (KIST) institutional program (2E24563).
References1. Correll DL. The role of phosphorus in the eutrophication of receiving waters: a review. J Environ Qual. 1998;27:261–266.
2. Morse GK, Brett SW, Guy JA, Lester JN. Review: phosphorus removal and recovery technologies. Sci Total Environ. 1998;212:69–81.
3. Loganathan P, Vigneswaran S, Kandasamy J, Bolan NS. Removal and recovery of phosphate from water using sorption. Crit Rev Environ Sci Technol. 2014;44:847–907.
4. Delorme F, Seron A, Gautier A, Crouzet C. Comparison of the fluoride, arsenate and nitrate anions water depollution potential of a calcined quintinite, a layered double hydroxide compound. J Mater Sci. 2007;42:5799–5804.
5. Miyata S. Anion-exchange properties of hydrotalcite-like compounds. Clay Clay Miner. 1983;31:305–311.
6. Costantino U, Marmottini F, Nocchetti M, Vivani R. New synthetic routes to hydrotalcite-like compounds – characterization and properties of the obtained materials. Ber Dtsch Chem Ges. 1998;1998:1439–1446.
7. Goh KH, Lim TT, Dong Z. Application of layered double hydroxides for removal of oxyanions: a review. Water Res. 2008;42:1343–1368.
8. Chen S, Xu ZP, Zhang Q, Lu GQM, Hao ZP, Liu S. Studies on adsorption of phenol and 4-nitrophenol on MgAl-mixed oxide derived from MgAl-layered double hydroxide. Sep Purif Technol. 2009;67:194–200.
9. Kim JH, Park JA, Kang JK, Son JW, Yi IG, Kim SB. Characterization of quintinite particles in fluoride removal from aqueous solutions. Environ Eng Res. 2014;19:247–253.
10. APHA (American Public Health Association). Standard methods for the examination of water and wastewater. Washington, DC: 1995.
11. Gupta SS, Bhattacharyya KG. Kinetics of adsorption of metal ions on inorganic materials: a review. Adv Colloid Interface Sci. 2011;162:39–58.
12. Yoon SY, Lee CG, Park JA, Kim JH, Kim SB, Lee SH, Choi JW. Kinetic, equilibrium and thermodynamic studies for phosphate adsorption to magnetic iron oxide nanoparticles. Chem Eng J. 2014;236:341–347.
13. Foo KY, Hameed BH. Insights into the modeling of adsorption isotherm systems. Chem Eng J. 2010;156:2–10.
14. Halajnia A, Oustan S, Najafi N, Khataee AR, Lakzian A. Adsorption–desorption characteristics of nitrate, phosphate and sulfate on Mg–Al layered double hydroxide. Appl Clay Sci. 2013;80–81. 305–312.
15. Cheng X, Huang X, Wang X, Zhao B, Chen A, Sun D. Phosphate adsorption from sewage sludge filtrate using zinc–aluminum layered double hydroxides. J Hazard Mater. 2009;169:958–964.
16. Das J, Patra BS, Baliarsingh N, Parida KM. Adsorption of phosphate by layered double hydroxides in aqueous solutions. Appl Clay Sci. 2006;32:252–260.
17. Zhang L, Hong S, He J, Gan F, Ho YS. Adsorption characteristic studies of phosphorus onto laterite. Desalination Water Treat. 2011;25:98–105.
Fig. 1Characteristics of quintinite: (a) FESEM image (bar=100 nm; inset=XRD pattern); (b) EDS pattern (inset=element composition). 
Fig. 3Kinetic sorption model analysis: (a) pseudo-first order model; (b) pseudo-second order model; (c) Elovich model. Model parameters are provided in Table 1. 
Fig. 4Phosphate sorption to quintinite: (a) effect of initial P concentration; (b) equilibrium isotherm model analysis. Model parameters are provided in Table 3. 
Fig. 5Phosphate sorption to quintinite: (a) effect of initial solution pH (the numbers in the parenthesis of X-axis = final (equilibrium) pHs), (b) comparison between synthetic solution and stream water (initial P concentration = 2 mgP/L). 
Table 1Kinetic Model Parameters Obtained from Model Fitting to Experimental Data Table 2Thermodynamic Parameters for Phosphate Sorption to Quintinite Particles
Table 3Equilibrium Model Parameters Obtained from Model Fitting to Experimental Data |
|
||||||||||||||||||||||||||||||||||||||||||||||||||||||||||||||