1. Introduction
Air pollution is one of the global problems that directly affect children’s health around the world especially in industrialized areas. Children are at greater risk and have a longer life expectancy than adults from the many adverse health effects of air pollution. Children have latent disease mechanisms that emerge and affect especially their lungs as they become rapidly weak to inflammation and other damage caused by pollutants [1]. The WHO reported almost 10% of childhood acute lower respiratory infection (ALRI) deaths are associated with ambient and household air pollutions in 2016 [2]. The ambient and household air pollutions are linked with 52,000 deaths of children aged 5–15 years. Exposure to pollutants such as fine particulate matter (PM2.5), nitrogen dioxide (NO2), carbon oxide (CO), sulfur dioxide (SO2), and ozone (O3) were associated with different health problems in children [3]. For example, some authors have reported about O3, NO2, PM2.5, and coarse particulate matter (PM10) were linked to the development of asthma, pneumonia, lung function, and other respiratory infections in children [4–7]. Children could be exposed to any of these pollutants from different places or routes which includes their homes, schools, through recreational facilities. Amongst all these places, the school environment is where students spend most of their hours of the day. Numerous studies point out that the main source of indoor pollutants is influenced by outdoor pollution such as traffic, industry, or combustion, while human activity inside includes painting, cleaning, building equipment, and furnishings [4, 8]. Several researchers have reported that indoor air pollution associated with NO2 can be found in schools [5, 9, 10]. The indoor NO2 found in schools are reported to have come from outdoor sources such as traffic and industrious industrial plants [9–11].
Nitrogen dioxide is a common gaseous pollutant released through vehicular emissions. It is the most toxic form of nitrogen oxide (NOX). Gokul Raj and Karthikeyan [12] revealed the mean of exposure NO2 concentrations for traveling by motorbike, car and bus were 1.04 ± 0.4, 0.69 ± 0.3 and 0.89 ± 0.3 μg/m3/min, respectively. Previously studied sources of NO2 inside school classrooms can be associated with the influence of outdoor air pollution. Villanueva et al. [10] investigated the levels of indoor NO2 in schools located in urban, industrial, and rural areas in Central-Southern Spain. They revealed that the Principle Component Analysis (PCA) to identify a common source of NO2 was originated from an outdoor source in the industrial area. Findings from Ayuni and Juliana [5] indicated that exposure to indoor NO2 concentrations may increase health risk among primary school children living near the petrochemical industry. Moreover, Ielpo et al. [13] presented the distribution source of NO2 released mainly from the vehicular traffic and secondarily to industrial source. The petrochemical industry can be a significant source of NOX [14, 15].
Passive samplers have been shown to be efficient, cost-effective, and do not require extensive calibration or maintenance. It can be attached to any object or person, depending on the measurement’s goal. After sampling, the passive sampler remains stable for several months and can be easily carried before and after exposure. As a result, it was ideal for developing a wide spatial network for NO2 monitoring. In several countries, passive samplers have been used to monitor NO2 concentrations in the outdoor and indoor air. In Italy, Motta et al. [16] developed passive sampler for evaluating NOx (NO+NO2) and reduced the hazards associated with the exposure to contaminants that are harmful to health. Using passive samplers, researchers in Thailand found that ambient NO2 concentrations at schools in Tha sala district, Nakhon Si Thammarat province by using passive samplers were greater at semester start (48.6 ± 2.3 to 78.1 ± 11.5 μg/m3) than during semester break (17.9 ± 0.3 to 43.8 ± 3.9 μg/m3) due to traffic [17]. In Sweden, investigation of indoor and outdoor levels of NO2 in schools by using diffusive samplers ranged from 2.9–47.0 μg/m3 (mean 17.3 ± 12.5 μg/m3) and 1.7–50.9 μg/m3 (mean 20.6 ± 16.0 μg/m3), respectively. The main source of indoor NO2 at the school was between 64–71% of the outdoor NO2 infiltration [18]. Olufemi et al. [19] employed passive samplers to measure inside and outside NO2 concentrations the school, as well as in the surrounding vicinities of the coal mine, South Africa, which used to passive samplers. They reported that the levels of NO2 inside and outside were between 19–28 μg/m3 and 9.9–27 μg/m3, respectively. Norbäck et al. [9] investigated indoor NO2 readings at Malaysian schools using a diffusion passive sampler. They found that NO2 levels of 23 μg/m3 were linked to ocular symptoms and weariness. Hence, children are more vulnerable to NO2 exposure than adults.
Numerous studies show significant associations between exposure to NO2 and the adverse health effects of children. For example, Zheng et al. [20] revealed that asthma emergency room visits and hospital admissions were more likely to be associated with NO2 exposure in children. Exposure to NO2 after 4 years of age might contribute to the development of asthma and this has been seen as asthma can be more reliably diagnosed [21]. Favarato et al. [6] reported ambient NO2 release from traffic pollution was associated with asthma prevalence in children, which could be oxidative stress/antioxidant depletion, increase inflammation and airway hyperresponsiveness, enhanced responses to allergens, and impacts on immunity. Song et al. [22] revealed the short-term association link between NO2 and eye and adnexa diseases (EADs), suggesting that NO2 generated by traffic could be considered as a useful bio-indicator of the harmful impacts of traffic-related air pollution exposure [23]. Moreover, Ayuni and Juliana [5] reported NO2 concentrations may increase the risk of respiratory illnesses and reduced lung function among elementary school children living close to petrochemical plants.
Based on the above facts, the researcher decided to determine firstly both indoor and outdoor NO2 concentrations and non-carcinogenic risk assessment in selected elementary schools in Rayong province. Secondly, to investigate the associations between the impacts of the determined pollutants on the health of the students. The physical signs included eye irritation, pink eye (allergic conjunctivitis), nasal congestion, runny nose, sore throat, rash in the face and the arms, faint, headache, fatigue, wheeze, and cough.
2. Materials and Methods
2.1. Sampling Site
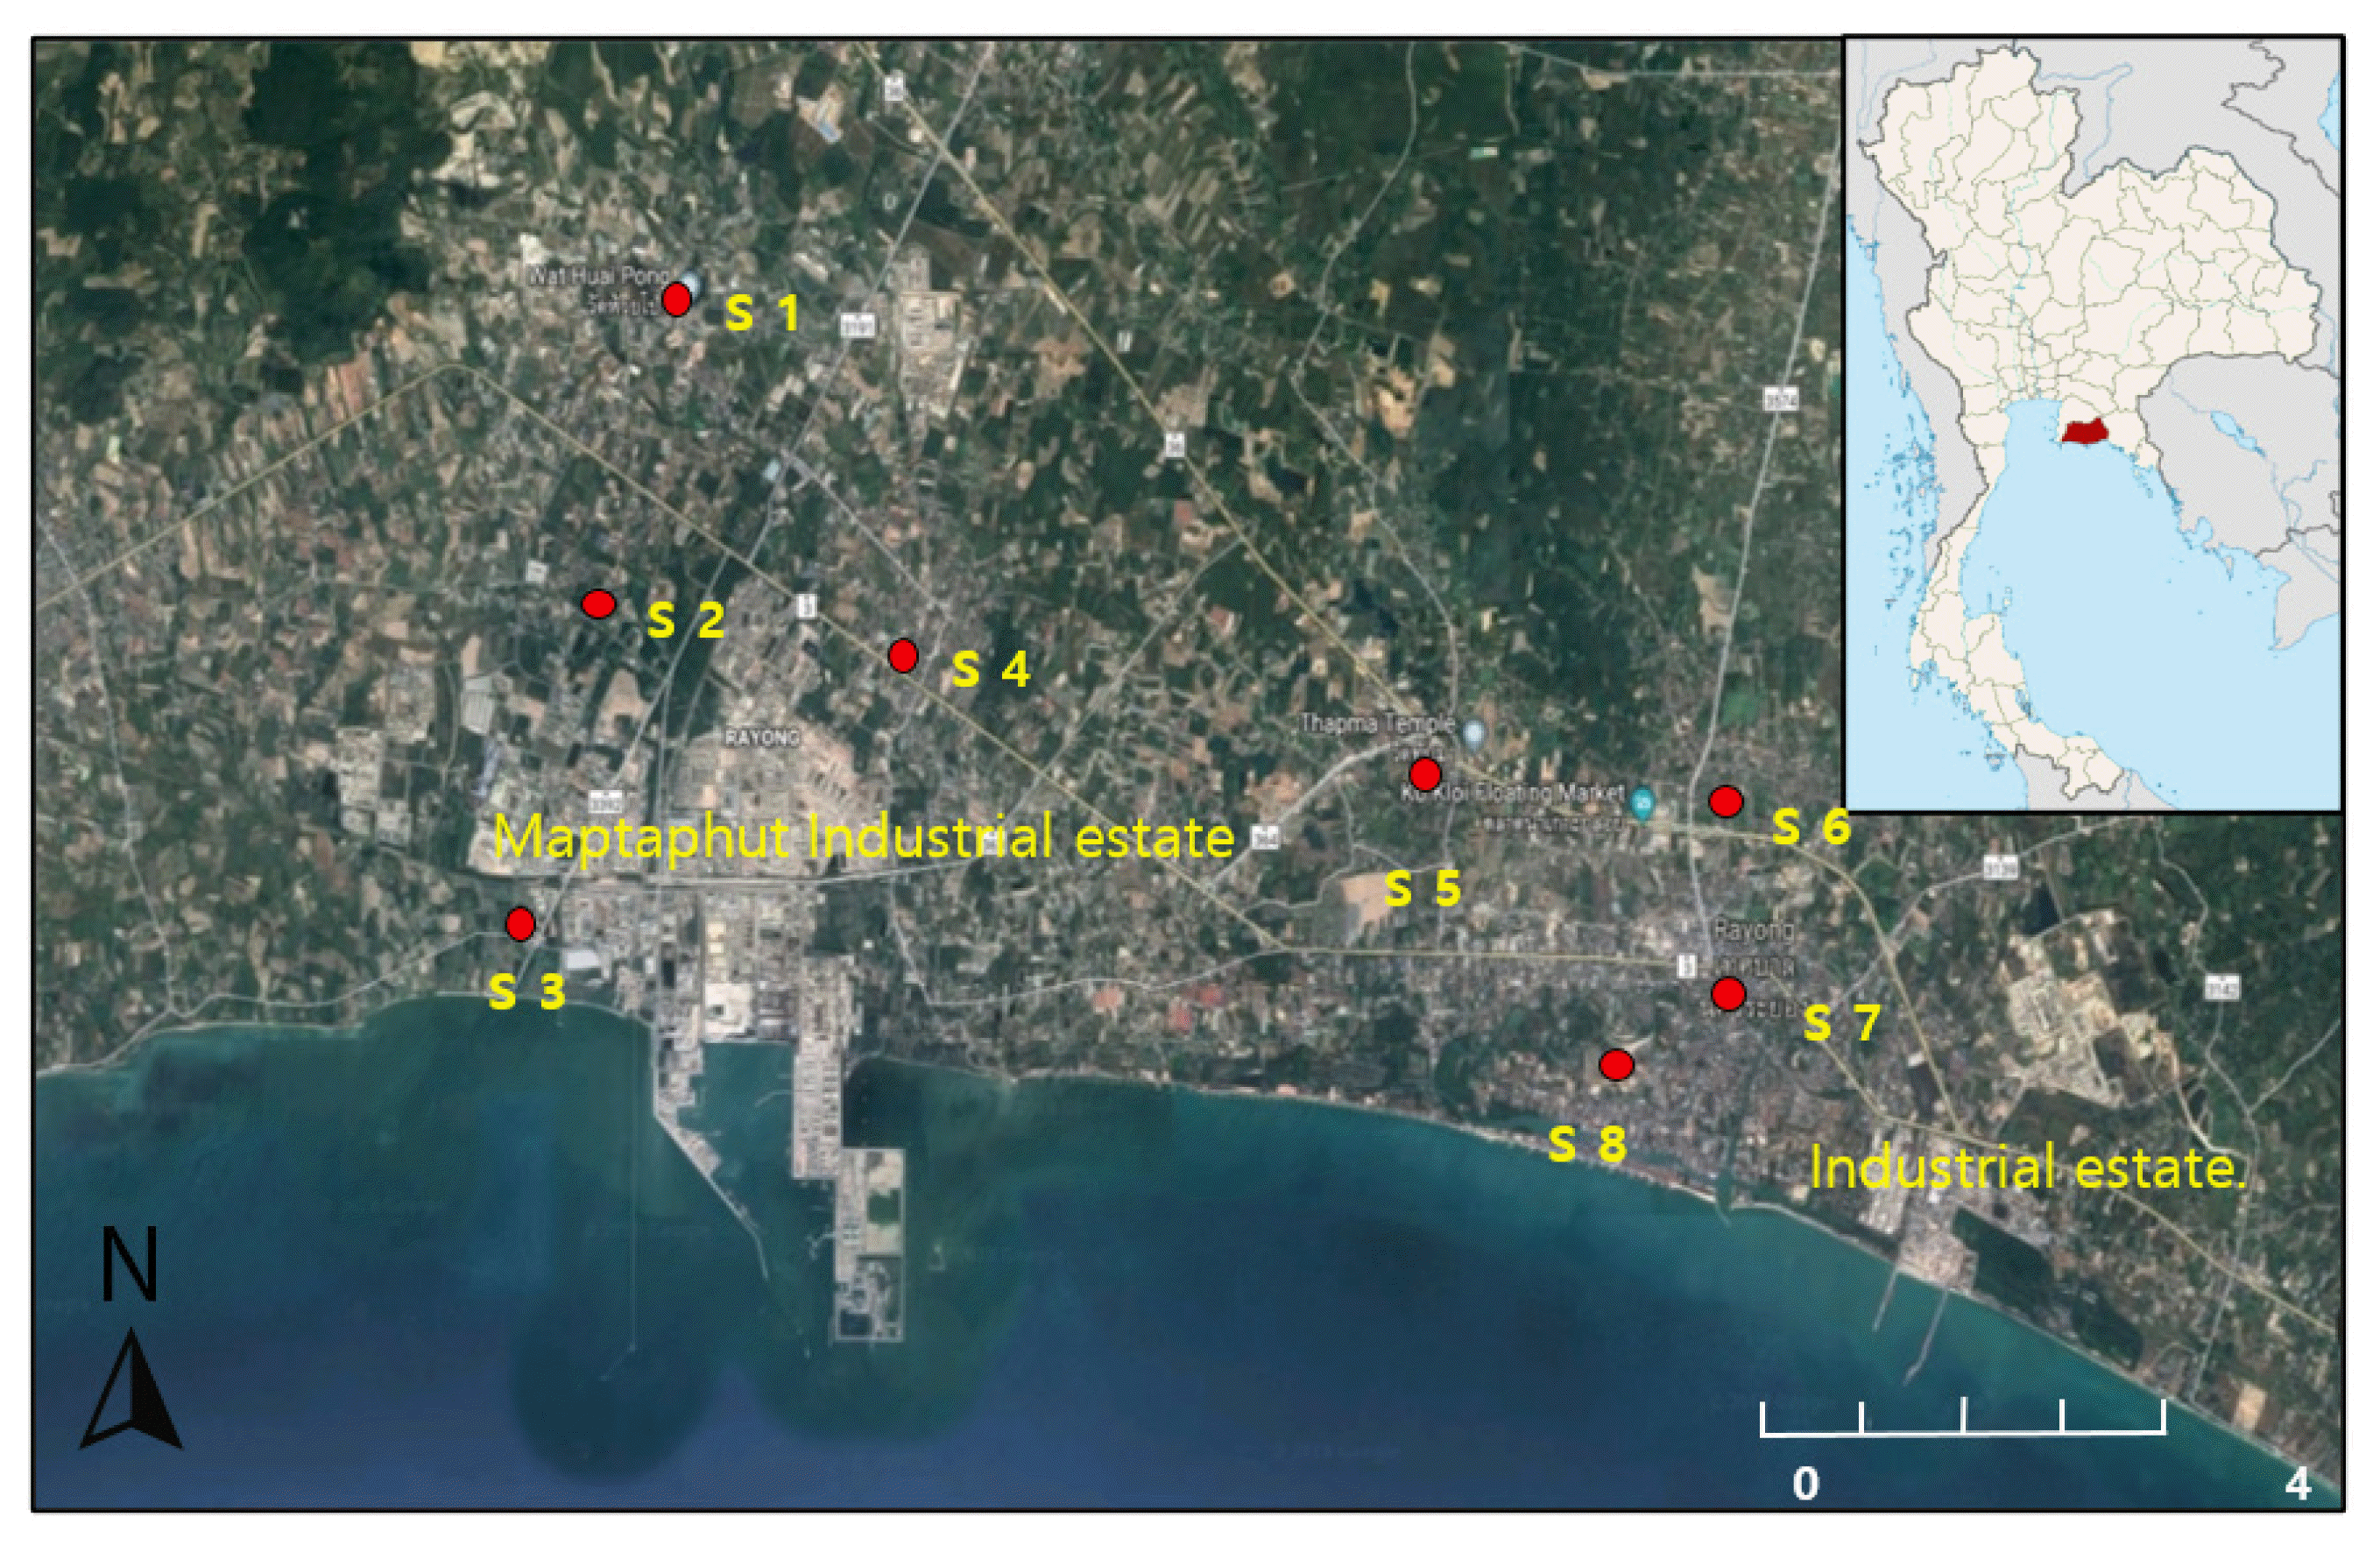
Rayong province is located in the eastern part of Thailand. It is one of the industrial estates in Thailand. Moreover, Rayong is one of three eastern provinces (Chachoengsao, Chonburi, and Rayong) selected to participate in the Thailand’s Eastern Economic Corridor’s area-based development project (EEC). The EEC project has been planned as part of Thailand’s 4.0 economic policy approach. The Maptaphut Industrial Estate is the main industrial estate in Rayong province, which was developed and began operations in 1989 and covers an area of 2,746.64 acres (shown in Fig. 1). The estate consists of 541 industrial plants, which include 6 coal-fired power plants, 148 petrochemical and chemical product plants, 7 petroleum plants, 2 oil refineries, 58 steel and metal factories, and 23 rubber processing plants [24].
The selected elementary schools are located in Rayong city municipality and Maptaphut municipality, Rayong province. There are forty-two elementary schools in downtown Rayong city. Eight elementary schools were randomly selected from 4 schools in Rayong city municipality and 4 schools in Maptaphut municipality as shown in Table S1 and Fig. 1. In each school, three classrooms of grade 1–6 students were randomly selected in each elementary school. The researchers selected based on the fact that these schools are close to industrial areas in Maptaphut municipality. Other elementary schools in Rayong city municipality are based on criteria of school roadside in a community area, traffic intensity, and transport networks.
2.2. Collection of NO2 Samples and Analysis
Indoor and outdoor NO2 samples were collected by lab-made polypropylene passive diffusion tubes (7.70 cm length and 1.50 cm inner diameter) from Environmental Chemistry Research Laboratory (ECRL), Chemistry department, Faculty of Science, Chiang Mai University [25]. The passive sampler was contained 20% triethanolamine (TEA) on GF/A filter paper (5 sampling tubes and 3 blank tubes). Sampling has been continuously exposed for 7 days (one sample) from September 2018 to February 2019. After the sampling, the NO2 concentration was determined colourimetrically as nitrite (NO2−). The samples were extracted by de-ionized water, Salzmann reagent, and NO2 concentrations were obtained from spectrophotometry (Shimadzu UV 2600, Japan) at 540 nm. Spectrophotometry was used to measure the sample solutions with Salzmann reagent serving as blank. Detailed pre-treatment and analysis procedures for the quality control/quality assurance (QC/QA) of NO2 could be found the limit of detection (LOD) and limit of quantification (LOQ) were 0.005 mg/L (0.14 μg/m3) and 0.015 mg/L (0.42 μg/m3), respectively.
The passive sampling inside the classroom was placed 1.0–1.5 m above the floor level, while the outdoor sampling was placed 1.5–2.0 m above the ground level. One set of sampling was collected from each classroom and one set of outdoor sampling.
2.3. Ethical Considerations
The present study was reviewed and approved by the Chiang Mai University Research Ethics Committee, Chiang Mai University, Certificate of Ethical Clearance No. 60/052 (COA No.017/61), 23 March 2018.
2.4. Questionnaire
A total number of 721 students from grades 1 to 6 in the selected elementary schools in Rayong Province participated in this study. Of the total number of 4,336 students in Rayong City Municipality, 366 students were selected. Also, of the 2,944 students in Maptaphut Municipality, 355 students were selected (Rayong primary educational service area office 1). The number of selected students was calculated by the formula of Taro Yamane [26]. It’s presented as Eq. (1).
Where n is sample size required, N is the number of students in the population and e is the acceptable sampling error based on a 95% confidence level and p = 0.5 The questionnaire was given to all students in the selected classroom for the sampling of NO2 concentrations and answered at home together with student parents. When the students returned the questionnaires to their teacher. The questionnaire comprised questions on socio-demographic factors on age, gender, weight, height, academic level, residential area, and smoking at home.
The questionnaire asked to elucidate the individual impacts of NO2 on 11 physical human health (symptoms) including ocular, nose, throat, dermal and general symptoms, which were shown in Table 5. Each question of symptoms had three alternative answers and was classified into three scores. The score of “0” was no or never, “1” if was the sometimes symptoms and the often symptoms indicated the score was “2”. The survey was conducted from January to March 2019. The recall period was over six months. After retrieving these questionnaires, a total of 638 questionnaires were analyzed.
2.5. Non-carcinogenic Risk Assessment
This research calculated a health risk assessment from the hazard quotient (HQ) to evaluate non-carcinogenic risk exposure of NO2 [3, 19]. The children’s health risk assessment to NO2 exposure pathway was referred the exposure factor articulated by the United State Environmental Protection Agency: 2011 Edition [27]. The average daily dose (ADD) through inhalation can be calculated as shown in Eq. (2).
Where ADD is the ADD of pollutants [28]; C is the concentration of NO2 (μg/m3); InhR is the inhalation rate (m3/h); ET is the exposure time (h/d); EF is the exposure frequency (d/year); ED is the exposure duration (years); BW is the bodyweight of the exposed group (kg) and AT is the average time (d). The values of these parameters were shown in Table 1.
The HQ was calculated from the ratio of ADD and the reference dose (RfD) of each pollutant using the following Eq. (3).
2.6. Data Analysis
The determination of the difference between indoor and outdoor nitrogen dioxide levels in schools was statistically analyzed using the T-test. One-way ANOVA with Tukey test analyzed the mean NO2 difference between the sampling of elementary schools. Pearson correlation analysis was used to assess the relations between the inside and outside of NO2 concentrations.
The statistic of questionnaire data was analyzed using the Chi-squared test (x2) to study the association between indoor NO2 concentrations in elementary schools and demographics characteristics. Considering that these results present all variables to be statistically significant with a level of p-value below 0.05. Multiple logistic regression was used to determine the association between NO2 levels in classrooms and physical human health variables. Odds ratios (OR) with 95% confidence intervals (95% CI) were calculated using SPSS version 25. A p-value below 0.05 with two-tailed tests was indicated to be a significance level.
3. Results and Discussion
3.1. NO2 Concentrations in Elementary Schools
The average concentrations of indoor NO2 were measured in classrooms at elementary schools in Rayong city as shown in Table 2. Ranges of indoor NO2 concentrations in the eight elementary schools were 9.0 ± 4.4 to 16.7 ± 2.7 μg/m3, while the values of outdoor were 8.2 ± 2.1 to 17.7 ± 6.7 μg/m3. The highest indoor NO2 concentration was found at the S4 site (16.7 ± 2.7 μg/m3), while the outdoor NO2 levels in the S1 site was the highest (17.7 ± 6.7 μg/m3). The cause of NO2 concentration in both sites is located close to a highway intersection with high traffic intensity and industrial area. In Spain, Villanueva et al. [10] reported the indoor and outdoor NO2 concentrations in primary school, which is situated in the industrial estate including refinery, chemical industry, two power plants, and a coal mine in Ciudad Real city. They found that the average of indoor NO2 concentrations were 13.4 ± 2.5 μg/m3 (9.8–15.8 μg/m3), while the values of outdoor were 6.0 ± 2.2 μg/m3 (3.7–9.2 μg/m3). Effect of traffic air pollution at schools in Barcelona, Spain, Rivas et al. [30] showed that the indoor and outdoor NO2 values in urban area were 5–69 μg/m3 (Mean 30±12 μg/m3) and 23–97 μg/m3 (mean 41 ± 15 μg/m3), respectively. However, the mean of indoor and outdoor NO2 concentrations in the industrial area at Rayong city found in this study was similar to those found inside primary schools in Spain, while those values were lower than in urban areas. Whereas when compared with studies from South Africa, for example as reported by Olufemi et al. [19], who conducted their study in five schools located close to the coal mines and coal-fired plants in Mpumalanga province. The result of their study revealed that the concentrations of NO2 both for indoor and outdoor were 19–28 and 9.9–27, respectively which were higher than the values reported in this present study (9.0–16.7 and 8.2–17.7 μg/m3, respectively). Norbäck et al. [9] reported indoor and outdoor concentrations in junior high school in Johor Bahru, Malaysia. It found that the levels of indoor and outdoor NO2 (17.0–32.3 and 16.9–26.9 μg/m3) were higher than those in this study (9.0 ± 4.4 to 16.7 ± 2.7 and 8.2 ± 2.1 to 17.7 ± 6.7 μg/m3). Moreover, Wichmann et al. [18] investigated that the indoor and outdoor NO2 concentrations in the primary schools of Stockholm, Sweden ranged between 2.9–47 and 1.7–50.9 μg/m3, respectively. The researchers of this study went further to expand that these high values were influenced by traffic emission. However, all the values of both indoor and outdoor NO2 complied with the recommended standard of guideline created by the National Ambient Air Quality Standard (NAAQS) and WHO (< 40 μg/m3) [1].
The One-Way ANOVA was used to test the difference in the mean of NO2 concentrations between elementary schools. The measured NO2 concentrations were tested for the normal distribution (Shapiro-Wilk normality tests), in which the samples were normally distributed. It was found that the indoor NO2 concentrations in elementary schools at S1 and S4 sites were not significantly different (p > 0.05), but they were significantly different from those in all the other sites (p < 0.05). The outdoor NO2 concentrations measured in the S1 site were slightly higher than those sites. The highest NO2 concentration was found at the S1 site, which is situated in the industrial area. It is closely located to a tapioca flour manufactory and near an intersection. Ielpo et al. [13] investigated the spatial distributions of NO2 concentrations from a different source of NO2. They reported that the emission sources of NO2 were linked mainly to the traffic density and secondarily to the industrial source. Therefore, it might cause increased NO2 contamination in classrooms. The lowest value of indoor NO2 concentrations was at the S2 site. It’s a well-known fact that this site is located in an industrial area and surrounded by governmental offices (Table S1). Because of the advantage of building material, the classrooms were built with wooden materials in the fact that there is a lower input of contaminants. The reason for this is that there is adequate ventilation. There is no forced ventilation in all the schools, thus ventilation is done by opening doors and windows. There was sufficient natural ventilated [8]. Furthermore, the major of wind direction in Rayong province was north-northeast from October 2018 to January 2019, which was winter season influenced to the northeast monsoon in Thailand. Not only the wind direction but also wind speed was low speed during the sampling period (1.24–1.63 m/s) as shown in Fig. S1. According to Chithra and Shiva [31], the low wind speed and calm conditions indicated that air pollution had accumulated. NO2 levels in Rayong province were found to be unaffected by wind direction. As a result, local activities such as traffic intensity and industry may influence NO2 concentrations.
The concentrations of NO2 indoor classrooms were compared with the classrooms outdoor of elementary schools in Rayong city. It was found that the concentrations of NO2 obtained outdoors (8.2 ± 2.1 to 17.7 ± 6.7 μg/m3) was slightly higher than indoors (9.0 ± 4.4 to 16.7 ± 2.7 μg/m3). However, the average NO2 concentrations between indoors and outdoors were tested using a T-test, there was not a significant difference in the findings (p > 0.05). In general, the study of the influence of outdoor air might be related to the observed indoor NO2 values, which could be supported by the inexistence of indoor sources by the indoor/outdoor (I/O) ratio results. The I/O ratios lower than 1 indicated that lower concentrations were observed indoors. The I/O ratios of NO2 concentrations in this study ranged from 0.71–1.29 (Table 2). A study conducted around some schools in Stockholm, Sweden reported that the range of I/O ratio of NO2 was 0.44–2.17 [18]. The study of Norbäck et al. [9] revealed the NO2 I/O ratios (0.80–1.59) at eight junior high schools in Malaysia were higher than this study. Moreover, Pearson’s rank-correlation was calculated in influence to associate the NO2 concentrations between indoor and outdoor (I-O) in elementary schools were shown in Table 2. The largest part of indoor NO2 concentrations in elementary schools was significantly correlated (p < 0.01) with concentrations of outdoor except for S3 and S4 sites. Because of accumulated NO2 from nearby industry and traffic congestion, NO2 levels within classrooms were found to be higher than outdoors for S3 and S4 sites. The strong positive correlations between indoor and outdoor NO2 concentrations were 0.723–1.000. The major cause of high NO2 concentrations indoors is as a result of emissions of NO2 from the outdoor environments such as traffic as confirmed by Nunes et al. [11]. Moreover, it was revealed in the study of Wichmann et al. [18] that the main source of indoor NO2 at schools was 64–71% of outdoor infiltrated indoor. It may be concluded that schools that are in proximity close to industrial plants and high traffic intensity are exposed to NO2 which may negatively affect the health of the students.
3.2. Non-Carcinogenic Risk Assessment for NO2 Concentrations
The results of the calculation for children’s health risks from inhalation of indoor and outdoor NO2 are presented in Table 3. The mean HQ values of indoor NO2 exposure for children (6– < 11 years) and teenagers (11–< 16 years) at elementary schools in Rayong city ranged 0.30 ± 0.14 to 0.55 ± 0.09 and 0.20 ± 0.10 to 0.39 ± 0.06, while the outdoor HQ values for NO2 inhalation were 0.27 ± 0.07 to 0.58 ± 0.22 and 0.19 ± 0.05 to 0.41 ± 0.16, respectively. HQ for NO2 exposure of both indoor and outdoor was less than 1.0, which is indicated no significant risk occurs. Moreover, all values of HQ for children and teenagers at elementary schools in Rayong city were less than 1.0. This finding isn’t considered a threat risk. Therefore, the non-carcinogenic risk assessment for inhalation of indoor and outdoor NO2 in elementary schools in Rayong city implied a negligible risk. Olufemi et al. [19] reported in their study that the HQ values for NO2 exposure in four schools in the vicinities of coal mines, South Africa were 0.001–0.002 for inside and 0.0007–0.0019 for outside, which was lower than what was reported in this study. However, the previous health risk studies have reported that even inhalation of a small quantity of NO2 might increase the risks of hospitalizations, asthma problems and rhinoconjunctivitis, respiratory problems, ocular symptoms, fatigue and decreased lung function in children [9, 20, 21, 32]. Flores-Pajot et al. [33] revealed that an increase of 10 ppb in NO2 during pregnancy was associated with an increased risk of autism. Zhang et al. [32] studied the association of the long-term mortality effect on chronic obstructive pulmonary disease (COPD) and NO2 concentration. They revealed that consistent evidence of the potential positive association between NO2 and COPD risk. An increase of 10 μg/m3 in NO2 concentration has been contributed towards an increase of 2.0% in associated COPD in adults and an increase of 1.3% in hospital admissions and an increase of 2.6% in mortality.
3.3. Associations between Indoor NO2 Exposure and Health of Students at Elementary Schools in Rayong City
3.3.1. Socio-demographics characteristics and symptoms
The gender of students was 325 boys (50.9%) and 313 girls (49.1%). The mean age was 9.7 years old and height 120.3 cm. A total of 43.9% was lived in the urban area (central town), 26.5% in the industrials area, and 25.7% in a sub-urban area, and 3.9% in the rural area as shown in Table 4. The socio-demographic characteristics of gender, age, height, urban area, sub-urban area, rural area and smoking at home were not significantly associated with NO2 values in classrooms (p > 0.05). However, the industrial area was significantly associated with NO2 concentrations (p < 0.05). The prevalence is the percentage of student in a population who have a particular symptom or trait at a given time or throughout a specific period of times, calculating the following Eq. (S1). The prevalence proportion of physical human health (symptoms) from students in elementary schools was shown in Table 5. The highest prevalence of symptoms in students was found the runny nose (89.2%), which was followed by cough (88.1%), nasal congestion (80.6%), sore throat (71.6%), headache (59.9%) and eye irritation (59.4%), respectively.
3.3.2. Associations between NO2 exposure and physical human health in classrooms
Exposure to NO2 in classrooms could be related to health risks. Table 5 presents the association between exposure to the indoor NO2 concentrations and the physical human health of students in classrooms. It found that the indoor NO2 was associated with prevalence of student symptoms including eye irritation (OR 2.64, 95%CI 0.42–4.76, p-value = 0.007), pink eye/ allergic conjunctivitis (OR 2.14, 95%CI 0.63–7.18, p-value = 0.012), runny nose (OR 3.52, 95%CI 1.26–9.42, p-value = 0.020), sore throat (OR 1.46, 95%CI 0.82–4.52, p-value = 0.038), wheeze (OR 0.86, 95%CI 0.28–3.12, p-value = 0.022) and cough (OR 1.66, 95%CI 0.82–3.42, p-value = 0.035). Moreover, an odds ratio is a measure of relationship between these two properties’ the presence or absence. According to odds ratio explanation, the probability of symptomatic eye irritation in student exposure to NO2 was assessed to be 2.64 times the odds of asymptomatic eye irritation. The 95% confidence interval for this odds ratio was between 0.42 to 4.76. The interval was rather wide because the numbers of students with asymptomatic eye irritation were low, etc.
The previous study on associations between indoor NO2 exposure and symptoms of students in primary schools was a significant variable. Norbäck et al. [9] revealed that NO2 in classrooms was associated with dry eyes or itching in the eyes (OR 2.34, 95%CI 1.40–3.90, p-value = 0.001) and fatigue (OR 1.67, 95%CI 1.12–2.47, p-value = 0.010). Song et al. [22] investigated the short-term association between NO2 and the risk of eye and adnexa diseases in Xinxiang, China. It found that exposure to NO2 was strongly associated with keratitis, which can increase the risk of hospital outpatients with eye and adnexa diseases. The 10-ppb increase of NO2 was related to an additional 6.8–7.5% of dry eye occurrence [34]. Navaes et al. [23] suggested that ocular discomfort symptoms and tear breakup time may be a bioindicator of the adverse health risk of traffic-derived NO2 exposure. It is well-known that NO2 can react with water vapour to form nitric acid, which might be the mechanism of the health effects of traffic exhaust fumes. Thailand is a tropical country with high air humidity [9]. Moreover, Javis et al. [35] reported that indoor NO2 was reacted moisture on the surface to the formation of nitrous acid (HONO), which can relate to a decline in lung function and respiratory problems. Several researchers reported that NO2 exposure of children can be associated with problems such as eczema, current wheeze, sore throat, and current rhinitis [4–6, 36]. Therefore, our study of the exposure to NO2 in classrooms found that this harmed children’s health, which was found to come from high traffic intensity and the industrial estate. According to Khamyingkert and Thepanondh [37], the petrochemical industry group in Maptaput industrial estates produced the highest annual average NO2 concentrations of 67.23%, followed by power plant industry group with 28.23%. Moreover, the daily number of vehicles passing through the highway road (NH36) was manually counted and estimated to be around 50,400 cars (Rayong city).
4. Conclusions
Based on the results of this study, it is concluded that the indoor NO2 concentrations in elementary schools in the vicinity of the industrial estate in Rayong city are caused by emissions from traffics and industrial plants. It was observed that NO2 values inside classrooms were strongly correlated with outdoor pollution conditions. Non-carcinogenic risk assessment of NO2 was used to assess the health risk of students in elementary was found that the HQ of all studied in elementary school was less than 1, revealing no health risk for children and teenagers. However, indoor NO2 concentrations in elementary schools could pose a significant risk to physical human health, with symptoms such as eye irritation, pink eye/ allergic conjunctivitis, runny nose, sore throat, wheeze and cough being among the most common in students. Therefore, children who spend time in classrooms at schools located near heavy traffic and petrochemical plant are most likely to suffer from related health problems.