1. Introduction
Over the past several decades, the world has witnessed rapid urbanization which results in the expansion of built-up areas in and around cities, changes in artificial landscape and generation of several environmental problems [1, 2]. Urbanization strongly affects local land surface and substantially alters the urban climate, leading to the well-known UHI effects [3–5]. The anthropogenically driven UHI represents the differences in albedo, roughness, heat and moisture flux exchange of the land surface. It is increasingly recognized that localized UHI effects interacted with global climate change have considerable social-economic consequences and high potential for health impacts [6–9]. Moreover, it usually introduces a warming bias in the observed surface air temperature series, similar to that of the increasing concentration of atmospheric greenhouse gases [3, 10–12]. Therefore, study of the urbanization effects on climate becomes an important component of urban climate change.
A number of studies have demonstrated that urbanization has contributed to the observed warming trends [10–16]. At a global scale, evidence shows that the UHI has a trivial influence on global temperature averages due to the urban areas only comprising about 1% of the Earth’s surface [11, 17–19]. However, the urbanization-induced warming becomes larger in local or national temperature observations which some locations have a similar magnitude or greater than that from greenhouse gas forced climate change [11, 12, 20–22]. Over the United States, Kalnay and Cai [23] found that, in nearly one century, the annual mean surface air temperature increased by 0.27 °C owing to land-use changes and urbanization. Zhang et al. [24] estimated the UHI contribution for the whole of China to be 27% during 1961–2004. At a sub-regional scale for southeastern, eastern, and northern China, the studies showed a wide range (10% to 40%) of urbanization contribution to observed warming for different periods during 1951–2010 [10, 13, 25, 26]. Based on various approaches, Tang et al. [27] and Wang and Ge [28] showed urbanization contribution during 1961–2009 of 35%–58% for large cities. The recent study based on homogenized observations and using improved methods has showed that the urbanization effects could account for about 20% of the observed warming trend at the Beijing Observatory during the last few decades [12]. Large fraction of the urbanization contribution to the observed warming is also reported in other big cities such as Colombo, Delhi, London, Vietnam, San Salvador and Wuhan [15, 29–32].
The urban minus rural (UMR) method is a direct technique widely used to examine the urbanization effects on observed surface temperature trends [11, 12, 19, 33]. It involves making comparison between the temperature trends at urban stations with those at nearby rural stations. A number of approaches which include socioeconomic indices (population, urban built-up area and growth development product) and nighttime light intensity and remote-sensed land-cover data are commonly employed to identify the urban and rural stations [11, 12, 19, 33]. In addition to the techniques used, the data quality is a comparably important factor for reliable estimation of the urbanization effects. Inhomogeneity caused by a number of non-climate factors such as changes in instruments, station moves, or different processing practices in the observed surface temperature data is often found as a major source of uncertainty in the estimation of urbanization-related warming [11–13, 19].
Based on homogenized data during 1970–2019 and the UMR method, this study investigates the urbanization effects on Tmean trends for Thailand where has recently experienced fast urbanization but the scientific information on the degree to which urbanization influences local and national surface climate is not well documented. Most of the previous studies focus on UHI analysis at an individual city scale especially Bangkok Metropolis [34–38]. Therefore, the main objectives are to analyze the differences in the rates of Tmean changes between the urban and suburban stations and rural stations, and to estimate the relative contribution of the urbanization effects to the trends of both individual station and country-wide average.
2. Data and Methods
This study has main steps of workflow consisting of compilation and selection of Tmean data and their quality checks, collection and analysis of land use and population data and classification of urban-type and non urban-type stations, and analysis of Tmean trends for different station types and the urbanization effects on them. The details of each main step of workflow are described in the following subsections.
2.1. Data Used and Quality Control
Monthly Tmean data from a dense observation network of Thai Meteorological Department (TMD) distributed across Thailand are used [39]. The TMD weather network was expanded in the early 1960s with the existing network having been more or less complete by the early 1970s. Data quality assurance is routinely performed, both real-time and post-processing [40, 41]. Air temperature is measured using thermometers placed in a Stevenson screen, a standardized well-ventilated shaded shelter at a height of approximately 1.2 m above the ground [40]. On the basis of record length and completeness, a set of 69 records with 50-year period (1970–2019) is initially selected to optimize data availability and spatial coverage. Overall, each of the selected records is at least 99% complete. Previous studies have demonstrated that temperature data from the TMD database are relatively good quality for climate studies [42, 43]. Nevertheless, all records are subjected to further statistical quality control checks. The objective approaches including tests of outliers, data missing interpolation and homogeneity test are employed to evaluate the quality of the selected data [44, 45]. For each record, outliers are identified by comparing their values to adjacent days and to the same day at nearby stations before they are edited or removed. Because of high correlations observed among Tmean data from nearby stations, the regression-based method of Feng et al. [44] is then applied to fill in the missing values by using data from the nearest neighboring stations.
The inhomogeneity of the data series is examined and adjusted, based on the penalized maximal t (PMT) test and the penalized maximal F (PMF) test [45, 46] using the RHtestsV4 software [47]. This technique is capable of detecting multiple step changes in time series by identifying the changepoints in a two-phase regression model [46]. In this study, inhomogeneity examination and adjustment are conducted on the monthly series. Analysis shows that 62 (89.9%) inhomogeneity records of Tmean data are detected. It is evident that most of original Tmean series underwent a systematic jump around 2006–2007. Further investigation reveals that the procedural calculation of daily Tmean was changed during that time. An absolute method which is not based on the nearby homogeneous stations as the reference series is then employed to adjust such inhomogeneity [48]. The recent period from 2007 onwards is used as the reference base to adjust the shift in the previous period, and the PMT test which assumes that the time series being tested has zero-trend and Gaussian errors [46] is applied to each independent inhomogeneous station. However, a relative technique which the candidate series is adjusted with the nearby homogeneous reference stations is applied for a few inhomogeneity records with multiple and random changes [48]. The homogeneous nearby stations well correlated with the inhomogeneous records are chosen as the reference series. All of the nearby stations used to construct the reference series have high correlations (r > 0.7) with the candidate series. The data after adjustments become more continuous and homogeneous, making they reasonably suitable for examining the urbanization effects on their trends. With this exercise, a set of 69 homogenized Tmean data spanning from 1970 to 2019 are obtained for further analysis (Fig. 1).
2.2. Classification of Stations
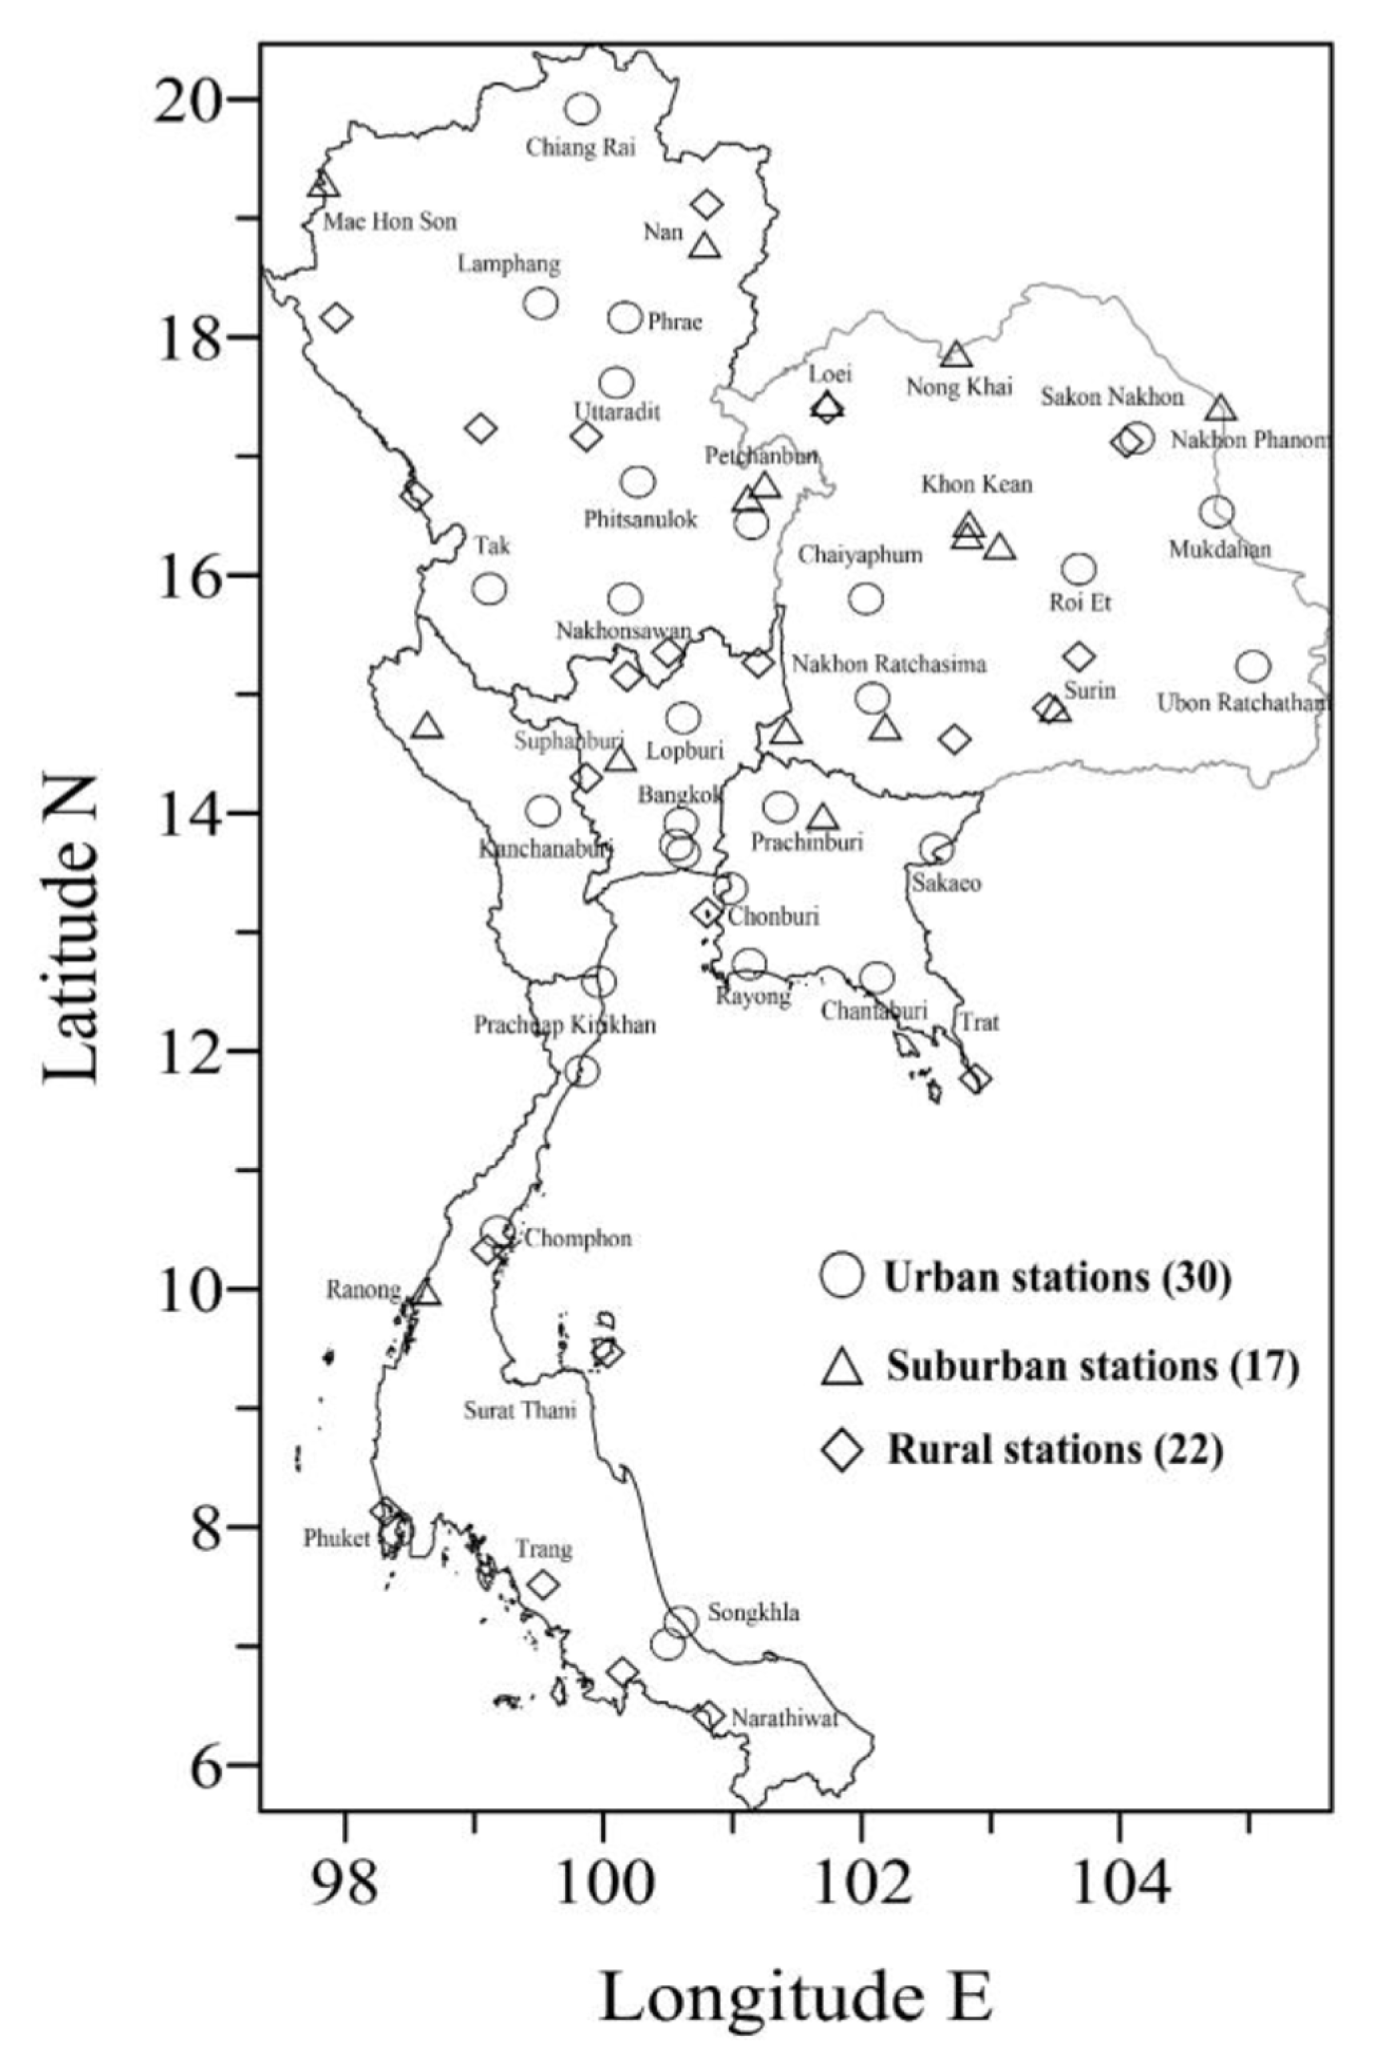
A key issue in examining the urbanization effects on temperature trend with the UMR method lies in the classification of urban-type and non-urban-type stations and the choice of reference stations which should be able to reflect macro-scale background climate change. In this study, we use two approaches to categorize urban-type and non-urban-type stations. Following Yang et al. [49], the differences in underlying surface and surrounding building environment of meteorological stations are first adopted to classify urban-type and rural-type stations. It is done by analyzing land use types within a radius of 2.5 km centered at each station. The analysis is based on aerial photograph-based land use data in 2012 from Land Development Department of Thailand with a scale of 1:25,000 [50]. The proportion of construction land-use type (urban and built-up) area to green area suggested by Yang et al. [49] is utilized to classify urban, suburban or rural stations (Table 1). If the stations with the proportion of construction land-use surroundings in 2012 greater than 50% with a radius of 2.5 km, they are then defined as urban-type weather stations. On the other hand, the proportion of construction land-use type area in 2012 less than 25% in 2.5 km radius buffer zone around the station is the criteria for selecting rural stations. We further analyze the LANDSAT 5/8 satellite images in 1988, 1998, 2008 and 2015 for some selected stations of each group in order to check validity of the above classification of land-use type (Figs. S1, S2 and S3). The results indicate that the proportion of urban or built-up land in 2000s for each station group is well met the criteria shown in Table 1. Based on this check, it provides additional confidence that the classification of urban, suburban, and rural stations based on land use data only in 2012 reflects the recent situations of surrounding building environment of each station group. Secondly, classification of stations on the basis of land use types is subsequently re-checked with population data. The population data in 2014 with more updated and complete version at sub-district level where each meteorological station is located are extracted from the database of Department of Provincial Administration [51]. We apply number and density of population (Table 1) as the criteria, since they are officially used to define different city sizes in Thailand as specified in the Municipality Act B.E. 2496. It is noted that the approaches used here are consistent well with field observations. Based on the above-described criteria, number of urban stations are largest (30), followed by rural stations (22) and suburban stations (17) in order (Fig. 1).
2.3. Analysis of Urbanization Effects on Observed Tmean
Following the studies of Ren et al. [13] and Yang et al. [25, 49], a pair of stations consisting of an urban/suburban station and a rural station with their distance ranging from 5 to 150 km is defined. For a given urban/suburban station, there may be more than one rural station within a radius of 50 km, and in that case the average is calculated. The urbanization effects (Tue) for an individual pair can be calculated as follows [13, 49, 52]:
where Tu/s is the observed temperature of the urban or substation station and Tr is the observed temperature of the rural station. Similarly, ΔTtre, defined as the difference in observational temperature trends (°C per decade) between urban or suburban station and rural station [13, 49, 52], can be expressed as:
and
are the linear trends (°C per decade) for the observed temperatures of the urban or suburban stations and rural stations, respectively. The contribution of urban-related warming, Cu, to total warming is then calculated [13, 49] as:
In the trend analysis, a Mann-Kendall test which has been widely used to detect trends in meteorological and hydrological time series is applied for each station and for Thailand as a whole [53–56]. The Mann-Kendal trend test is non-parametric ranked based procedure which the correlation between the rank order of the observed values and their order in time is considered [53, 56]. It is good for use with non-normally distributed variables and highly resistant to the effects of outliers [53, 56]. In this study, we used a modified version proposed by Hamed and Rao [56] which can account for time series autocorrelation by modifying the variance of the Mann-Kendal statistic S. A trend is taken to be statistically significant when the probability is at 95% level (p = 0.05). Country-wide time series for each station group is also created by averaging the anomalies of all stations to the base period from 1971 to 2000.
3. Results and Discussion
3.1. Trends of annual Tmean in Thailand
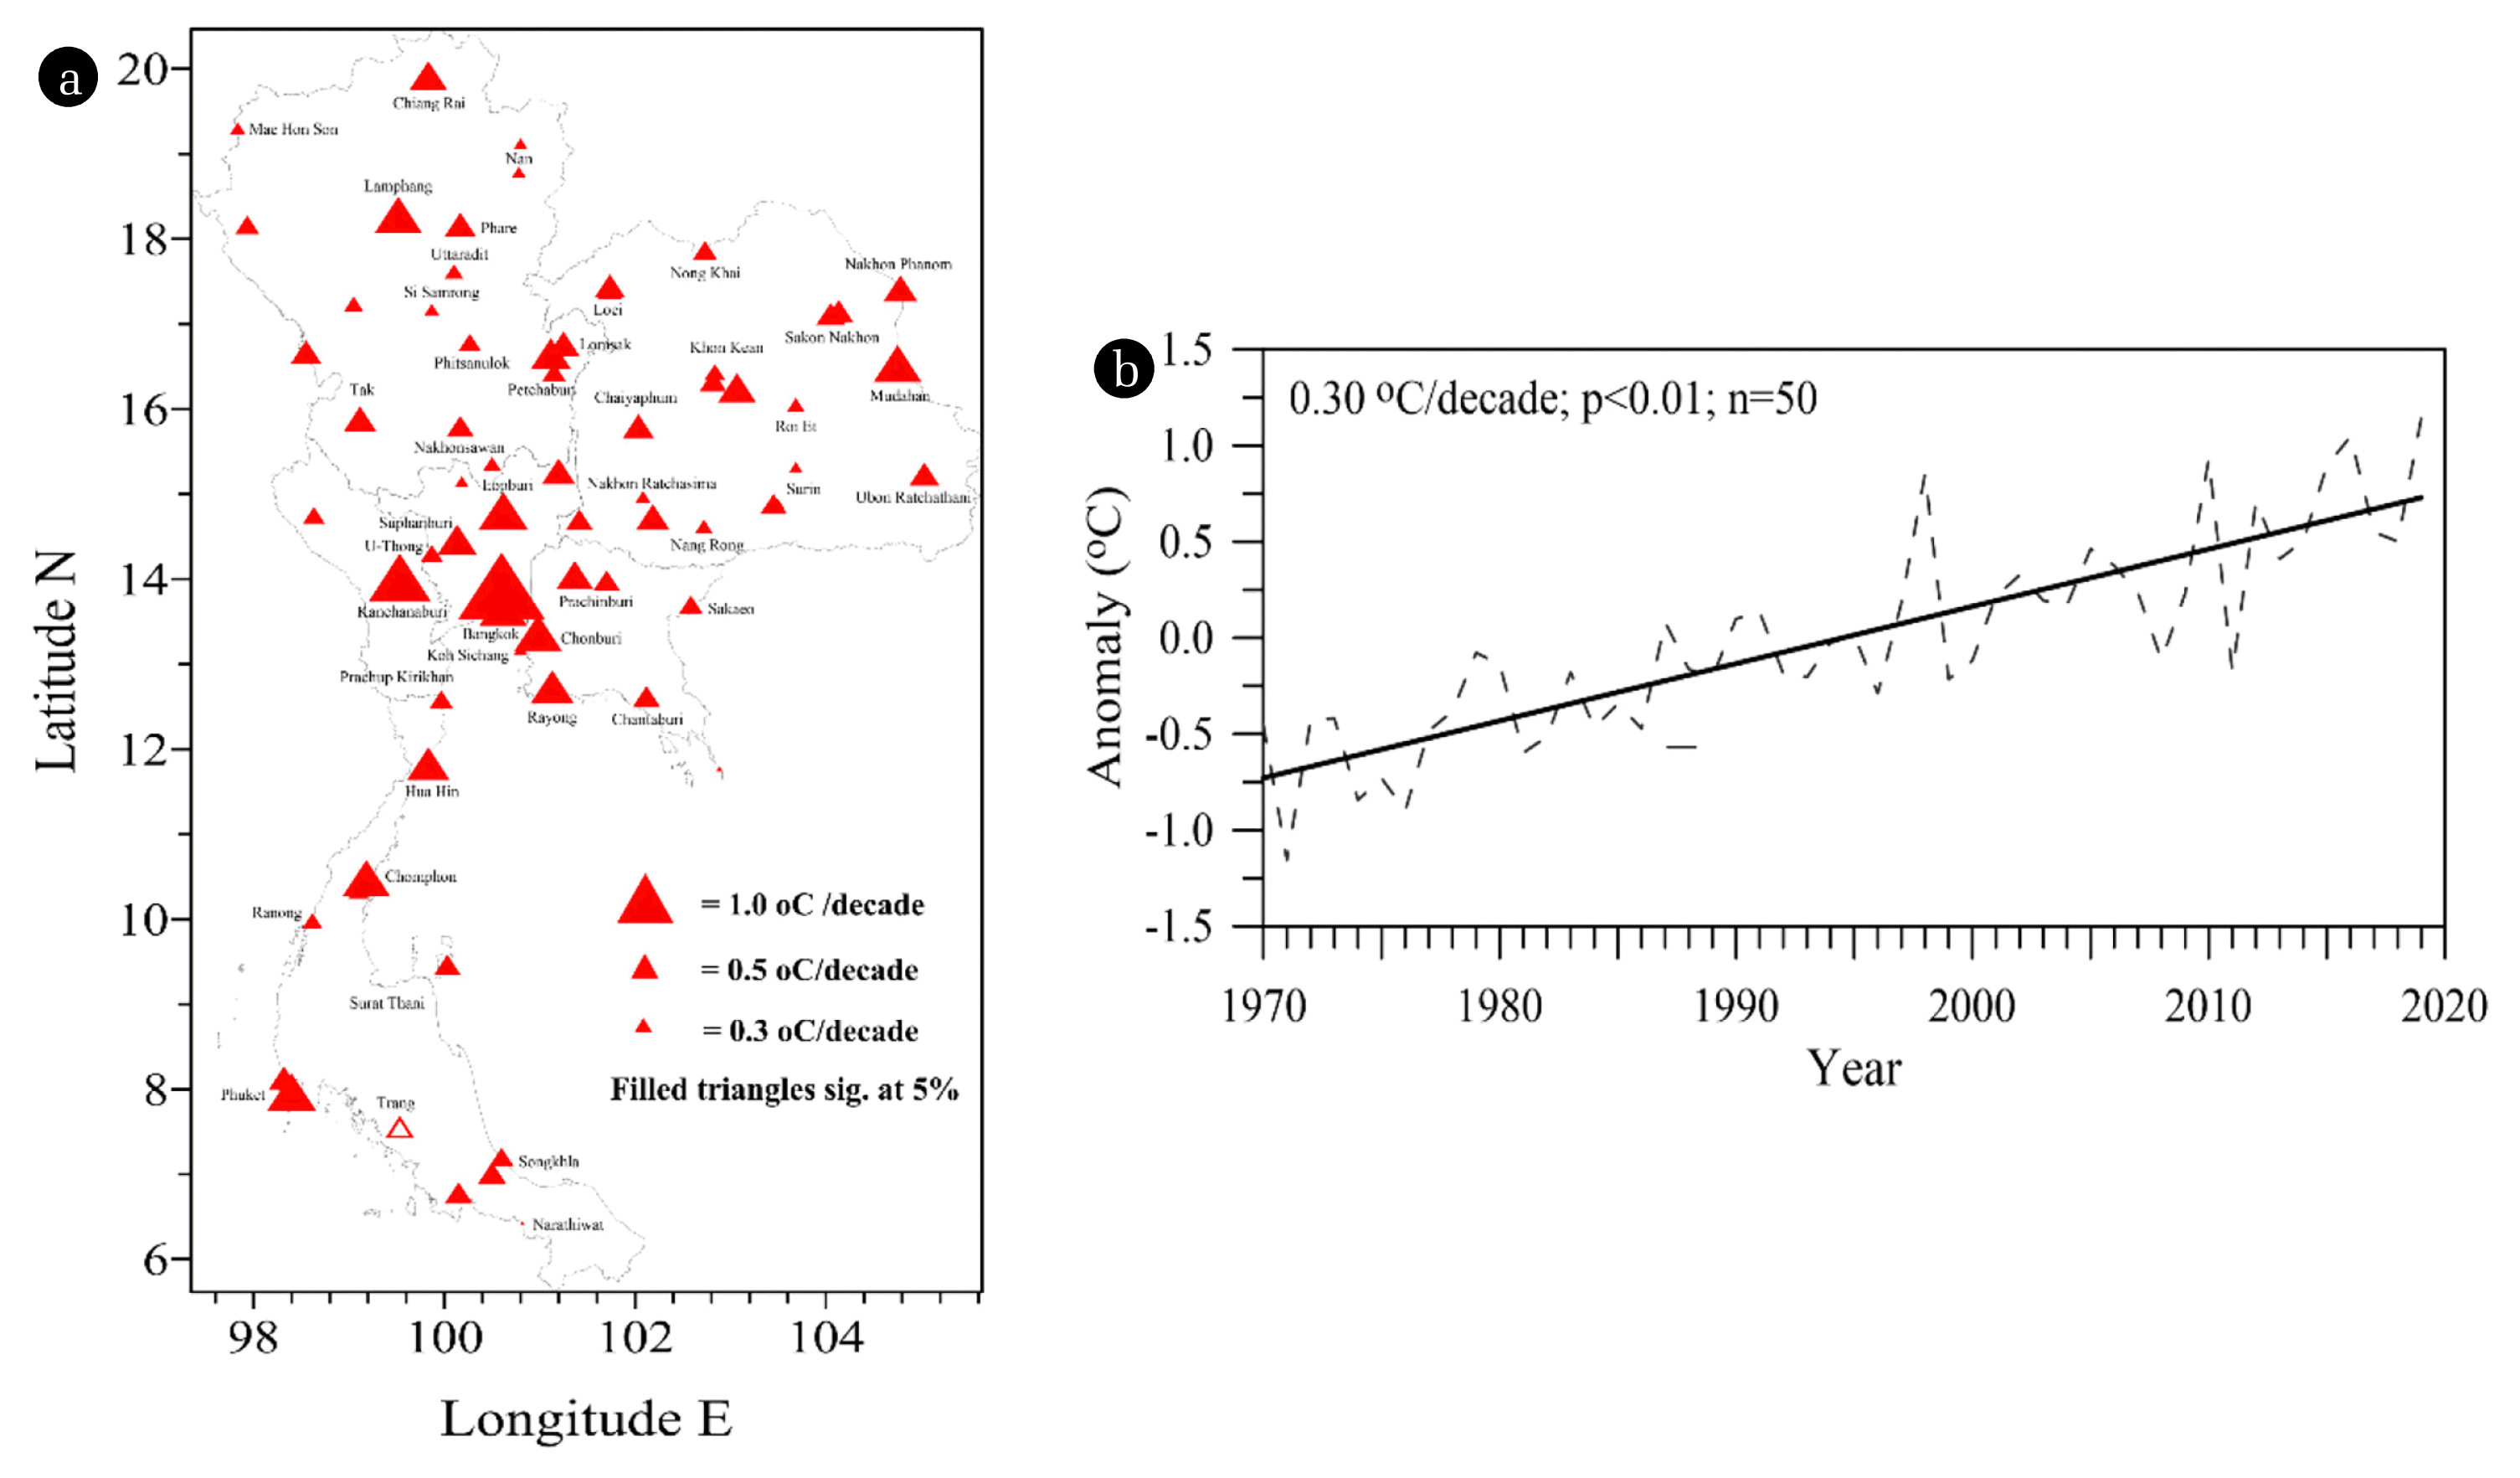
Station-by-station trends estimated based on the newly homogenized data reveal a spatially coherent and widespread significant increase of annual Tmean in Thailand during 1970–2019, consistent with the earlier study of Limjirakan and Limsakul [42] and general warming observed at regional and global scales [57–62]. Analysis shows that almost all stations (98.6%) record statistically significant increase ranging from 0.05 to 0.92°C per decade (Fig. 2(a)). One of prominent features emerged from Fig. 2(a) is that the stations located at the urban and suburban areas exhibit higher increasing trends in annual Tmean compared with those situated at the rural area. These obvious differences may reflect varying degree of land use change especially urban expansion in addition to large-scale background changes. An exceptionally large increase in annual Tmean is observed at the highly urbanized Don Muang Station located in Bangkok Metropolis. Based on LANDSAT 5/8 thermal infrared data, Sanecharoen et al. [37] also found that land surface temperature in inner Bangkok city during 2008–2014 was greater 3°C higher than suburban area. Averaging all stations to present Thailand as a whole, annual Tmean has increased significantly by 0.30°C per decade during 1970–2019 (1.50°C per 50 years) (Fig. 2(b)). Using the same observed data but shorter period for the period 1970–2009, Limjirakan and Limsakul [42] reported an increase of annual Tmean in the whole of Thailand by 0.23°C per decade (0.92°C per 40 years). In comparison with the earlier results, the increasing rate of annual Tmean derived from this study is larger, probably indicating either improved inhomogeneity adjustment or a greater increase in the recent years detected based on longer quality controlled and homogenized data, or combination of both. However, our country-wide average value is in range of those values reported in Vietnam [59], Mainland China [58], and Central Asia [62].
3.2. Urban Warming Trends and Their Contribution to Overall Warming
Seasonal feature of Tmean trends in Thailand averaged each three-month season -winter (DJF), spring (MAM), summer (JJA), and autumn (SON) for three station groups, which is weak and insignificant correlations with the seasonal pattern of rainfall, is consistent with the previous studies [13, 19, 25, 30], with the largest warming appearing in wintertime (Table 2). Greater greenhouse effect resulting from larger temperature differential between the atmosphere and the sea surface in winter than other seasons may be one of possibilities causing such observed strongest warming [63]. The second largest warming occurs in autumn, followed by summertime with the least warming seen in springtime (Table 2). In the four seasons, each of the station groups experiences different warming which the strongest warming trends in Tmean all appear at urban stations, whereas rural stations show the smallest trends (Table 2). These results suggest that each of the station groups in Thailand exhibits different degree of warming and seasonally dependent, agreement with the evidence observed in China [12, 13, 19, 25, 30].
Relative contribution of urban warming to the overall warming in Thailand shows different seasonal pattern with large spatial variations (Table 2). The results show that wintertime contributes lower urban warming than springtime and summertime even though it registers the largest overall warming (Table 2). Such small contribution in winter indicates that the UHI is not a major contributor to the large wintertime warming in Thailand, in line with the results of Ren et al. [13] and Yang et al. [25] for north and east China. The weaker wintertime UHI observed in Thailand may result from the combined effect of lower solar radiation and decreased anthropogenic heat release during winter season [64, 65] thereby reducing urban to rural contrasts in energy balance [66]. On the other hand, the seasonal means of urban warming contribution generally increase from winter to spring and gradually decline thereafter (Table 2). The spring peak of urban warming contribution in Thailand is consistent with the results of Jauregui et al. [67], Ren et al. [30] and Yang et al. [25] that the UHI intensity in Mexico City, Beijing and east China is largest during the dry season. Previous studies have also shown that seasonal variations of the UHI in the tropical cities are evidently more related to urban-rural surface moisture characteristics with higher intensities during the dry season [68, 69]. Our results also agree well with the studies carried out in Thailand based on both station observations and satellite-measured data showing that UHI intensity in Bangkok, Chiang Mai and Songkhla is strongest in dry season [34–38]. The maximum UHI intensity of around 6–7°C in Bangkok is found during dry season [35]. Anthropogenically generated heat in the urban area which can produce a shallow boundary layer in late-winter to mid-spring when local atmospheric circulation is relatively weak and climate conditions are clam may be possible explanation [30]. These climate conditions are developed well over Thailand during dry and hot boreal spring season which can subsequently induces enhanced UHI intensity with its impact being especially strong as observed in springtime. In addition, the studies of Roth [68] and Cui and de Foy [69] pointed out that the signal of UHI in the tropical cities was relatively weak during the rainy season. They showed that UHI intensities during this period fell dramatically as a result of strong wind and cloudiness and high rainfall amount. We believe that gradual decline of urban warming contribution observed during the rainy season (from spring to summer) (Table 2) may be caused by the effects of clouds and moisture availability, because rainfall amount and cloudiness in Thailand are substantially higher during this period.
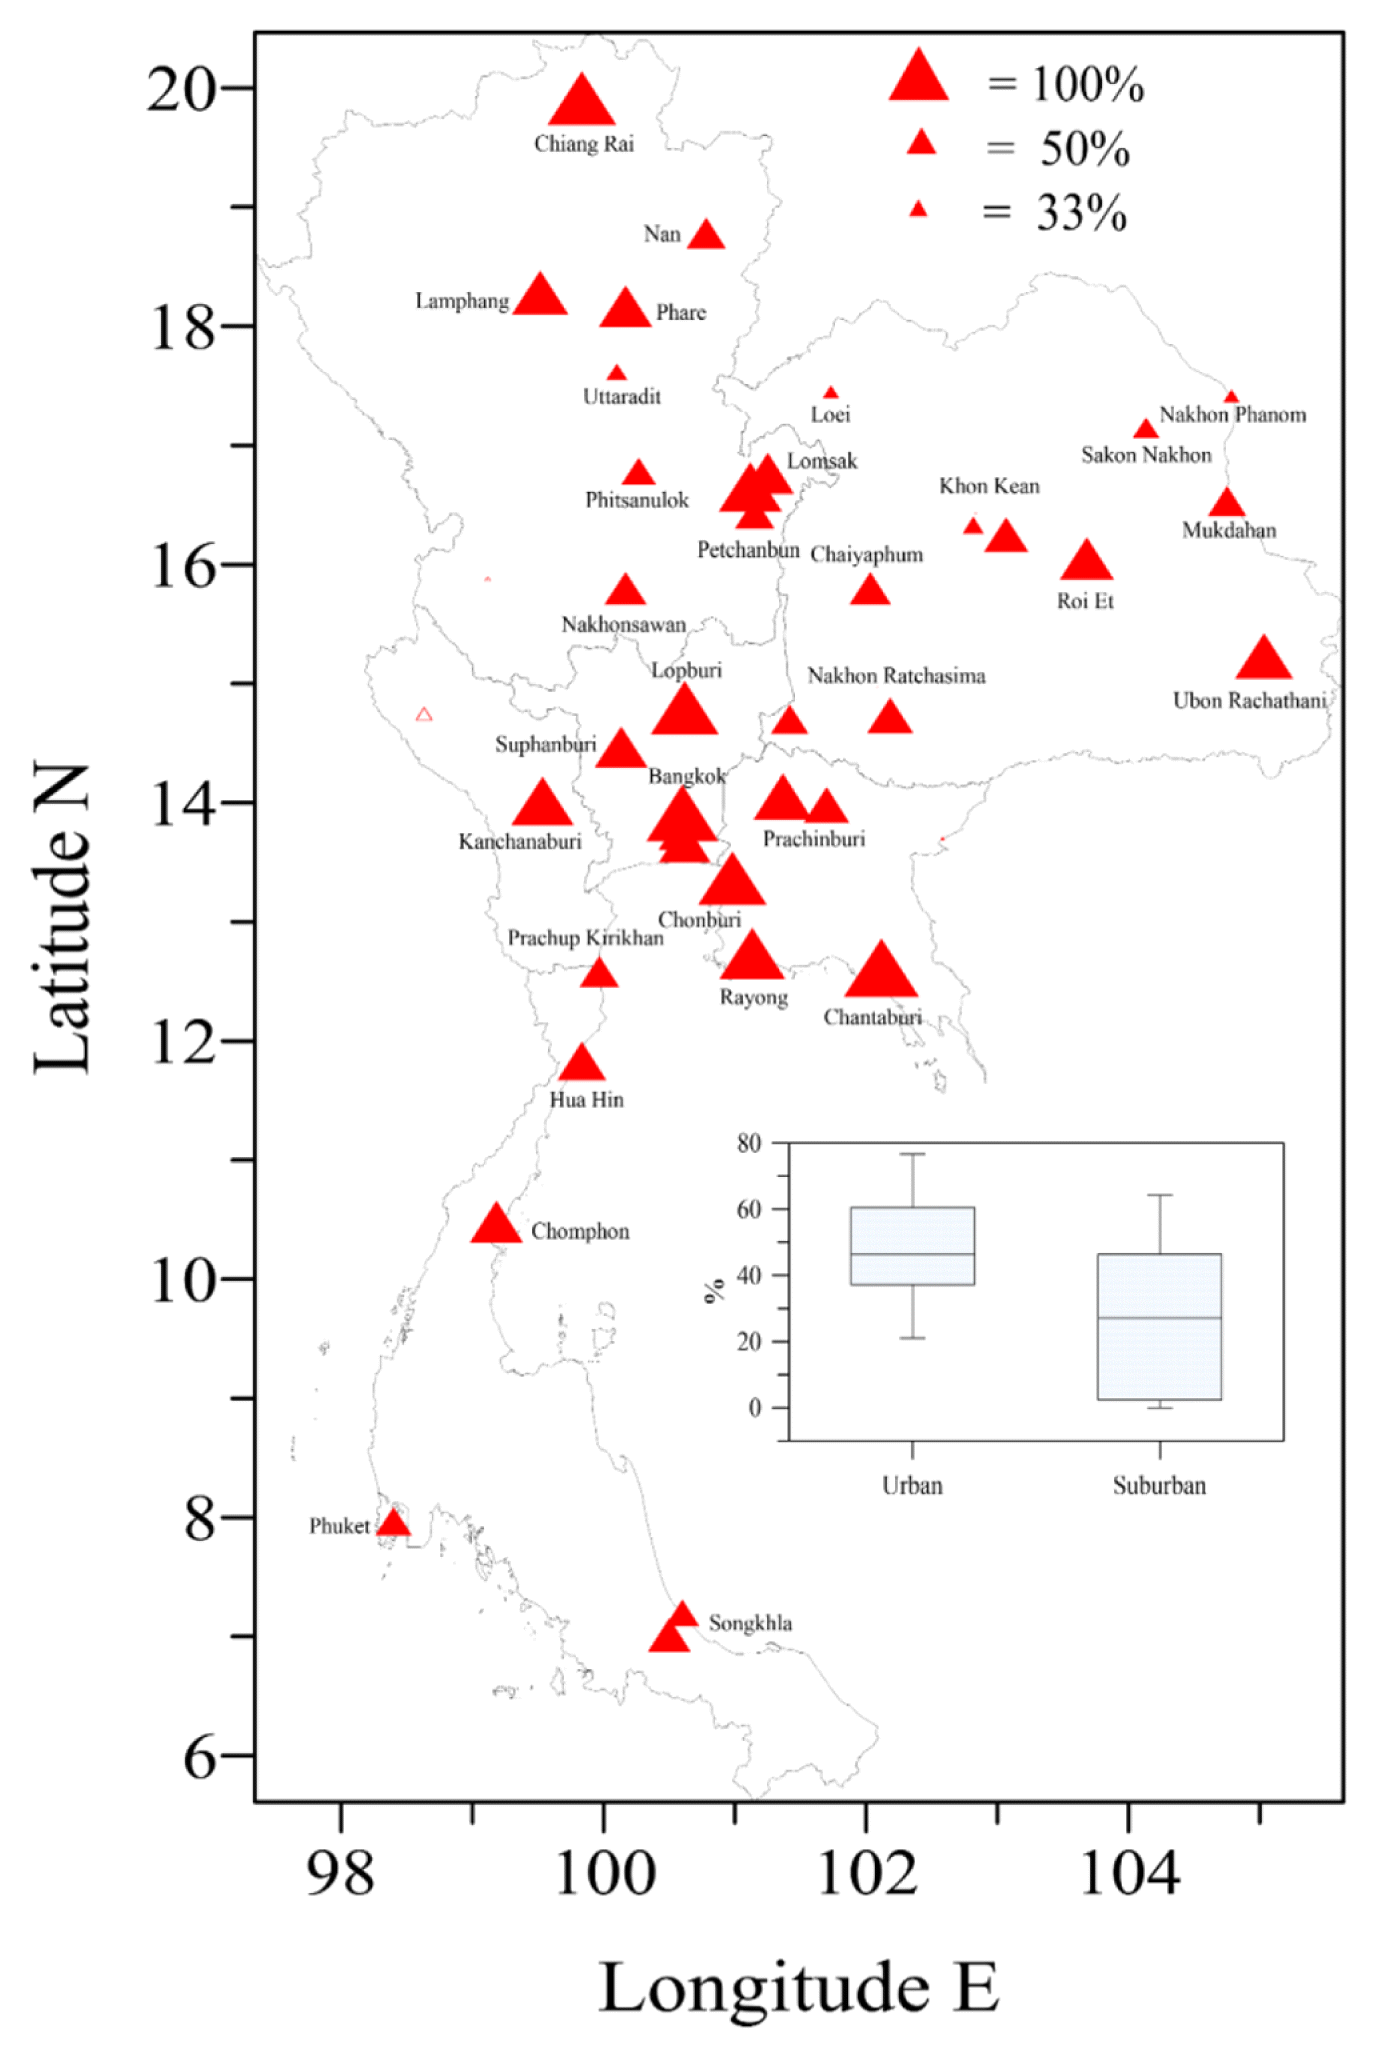
Spatial map of annual urban warming to the overall warming in Thailand is marked by a wide range of contribution (less than 5% up to 77%) (Fig. 3). Such contribution probably reflects the UHI differences from city to city as a result of the varied urban characteristics and climatic background. In case of Bangkok Metropolis, for example, recent studies have shown that city structures, population and weather especially southwesterly wind direction and persistence are important factors governing and modulating the UHI variations [35, 38]. There are 39 (83%) out of 47 urban and suburban stations recorded significant urban warming contribution. Across Thailand, large urban warming contribution is geographically concentrated in central and eastern parts of the country (Fig. 3) where rapid urbanization and industrial and economic development have been taken place over the last few decades [70]. The first three stations with the largest urban-warming contribution are observed at Don Muang, Chonburi and Chantaburi (Fig. 3). Noticeably substantial urban-warming contribution can also be seen at some stations located in the North and Northeast (Fig. 3). When considering contribution separately for each station group, it is evident that urban stations contribute nearly two times more warming than suburban stations do, but the warming contribution from suburban stations exhibits larger variation (Fig. 3).
To further illustrate the overall picture of warming trends and warming contribution in Thailand for each station group, analysis based on country-wide time series of annual average Tmean shows different significant positive trends for all groups (Fig. 4). The largest increase occurs at the urban station group with a linear trend reaching 0.37 °C per decade; Next comes to the suburban group station with a linear trend of 0.28 °C per decade, while the smallest rise which is only 0.20°C per decade is observed at the rural station group (Fig. 4). As a consequence, the difference between urban and suburban stations combined and rural stations as urban warming contribution shows a significant upward trend of 0.15°C per decade for the last 50 years, accounting for 40.5% of the overall warming (Fig. 4). Urban warming contribution observed in Thailand as a whole is comparable to some previous studies carried out in China and the United States [10, 13, 24, 25, 27, 28, 30, 71]. Our results indicate that urban expansion has great influence on surface warming, and the urban-warming bias contributes large fraction of observed rising annual Tmean in Thailand.
3.3. Relationships between Annual Tmean Trends and Some Urbanization-Proxy Variables
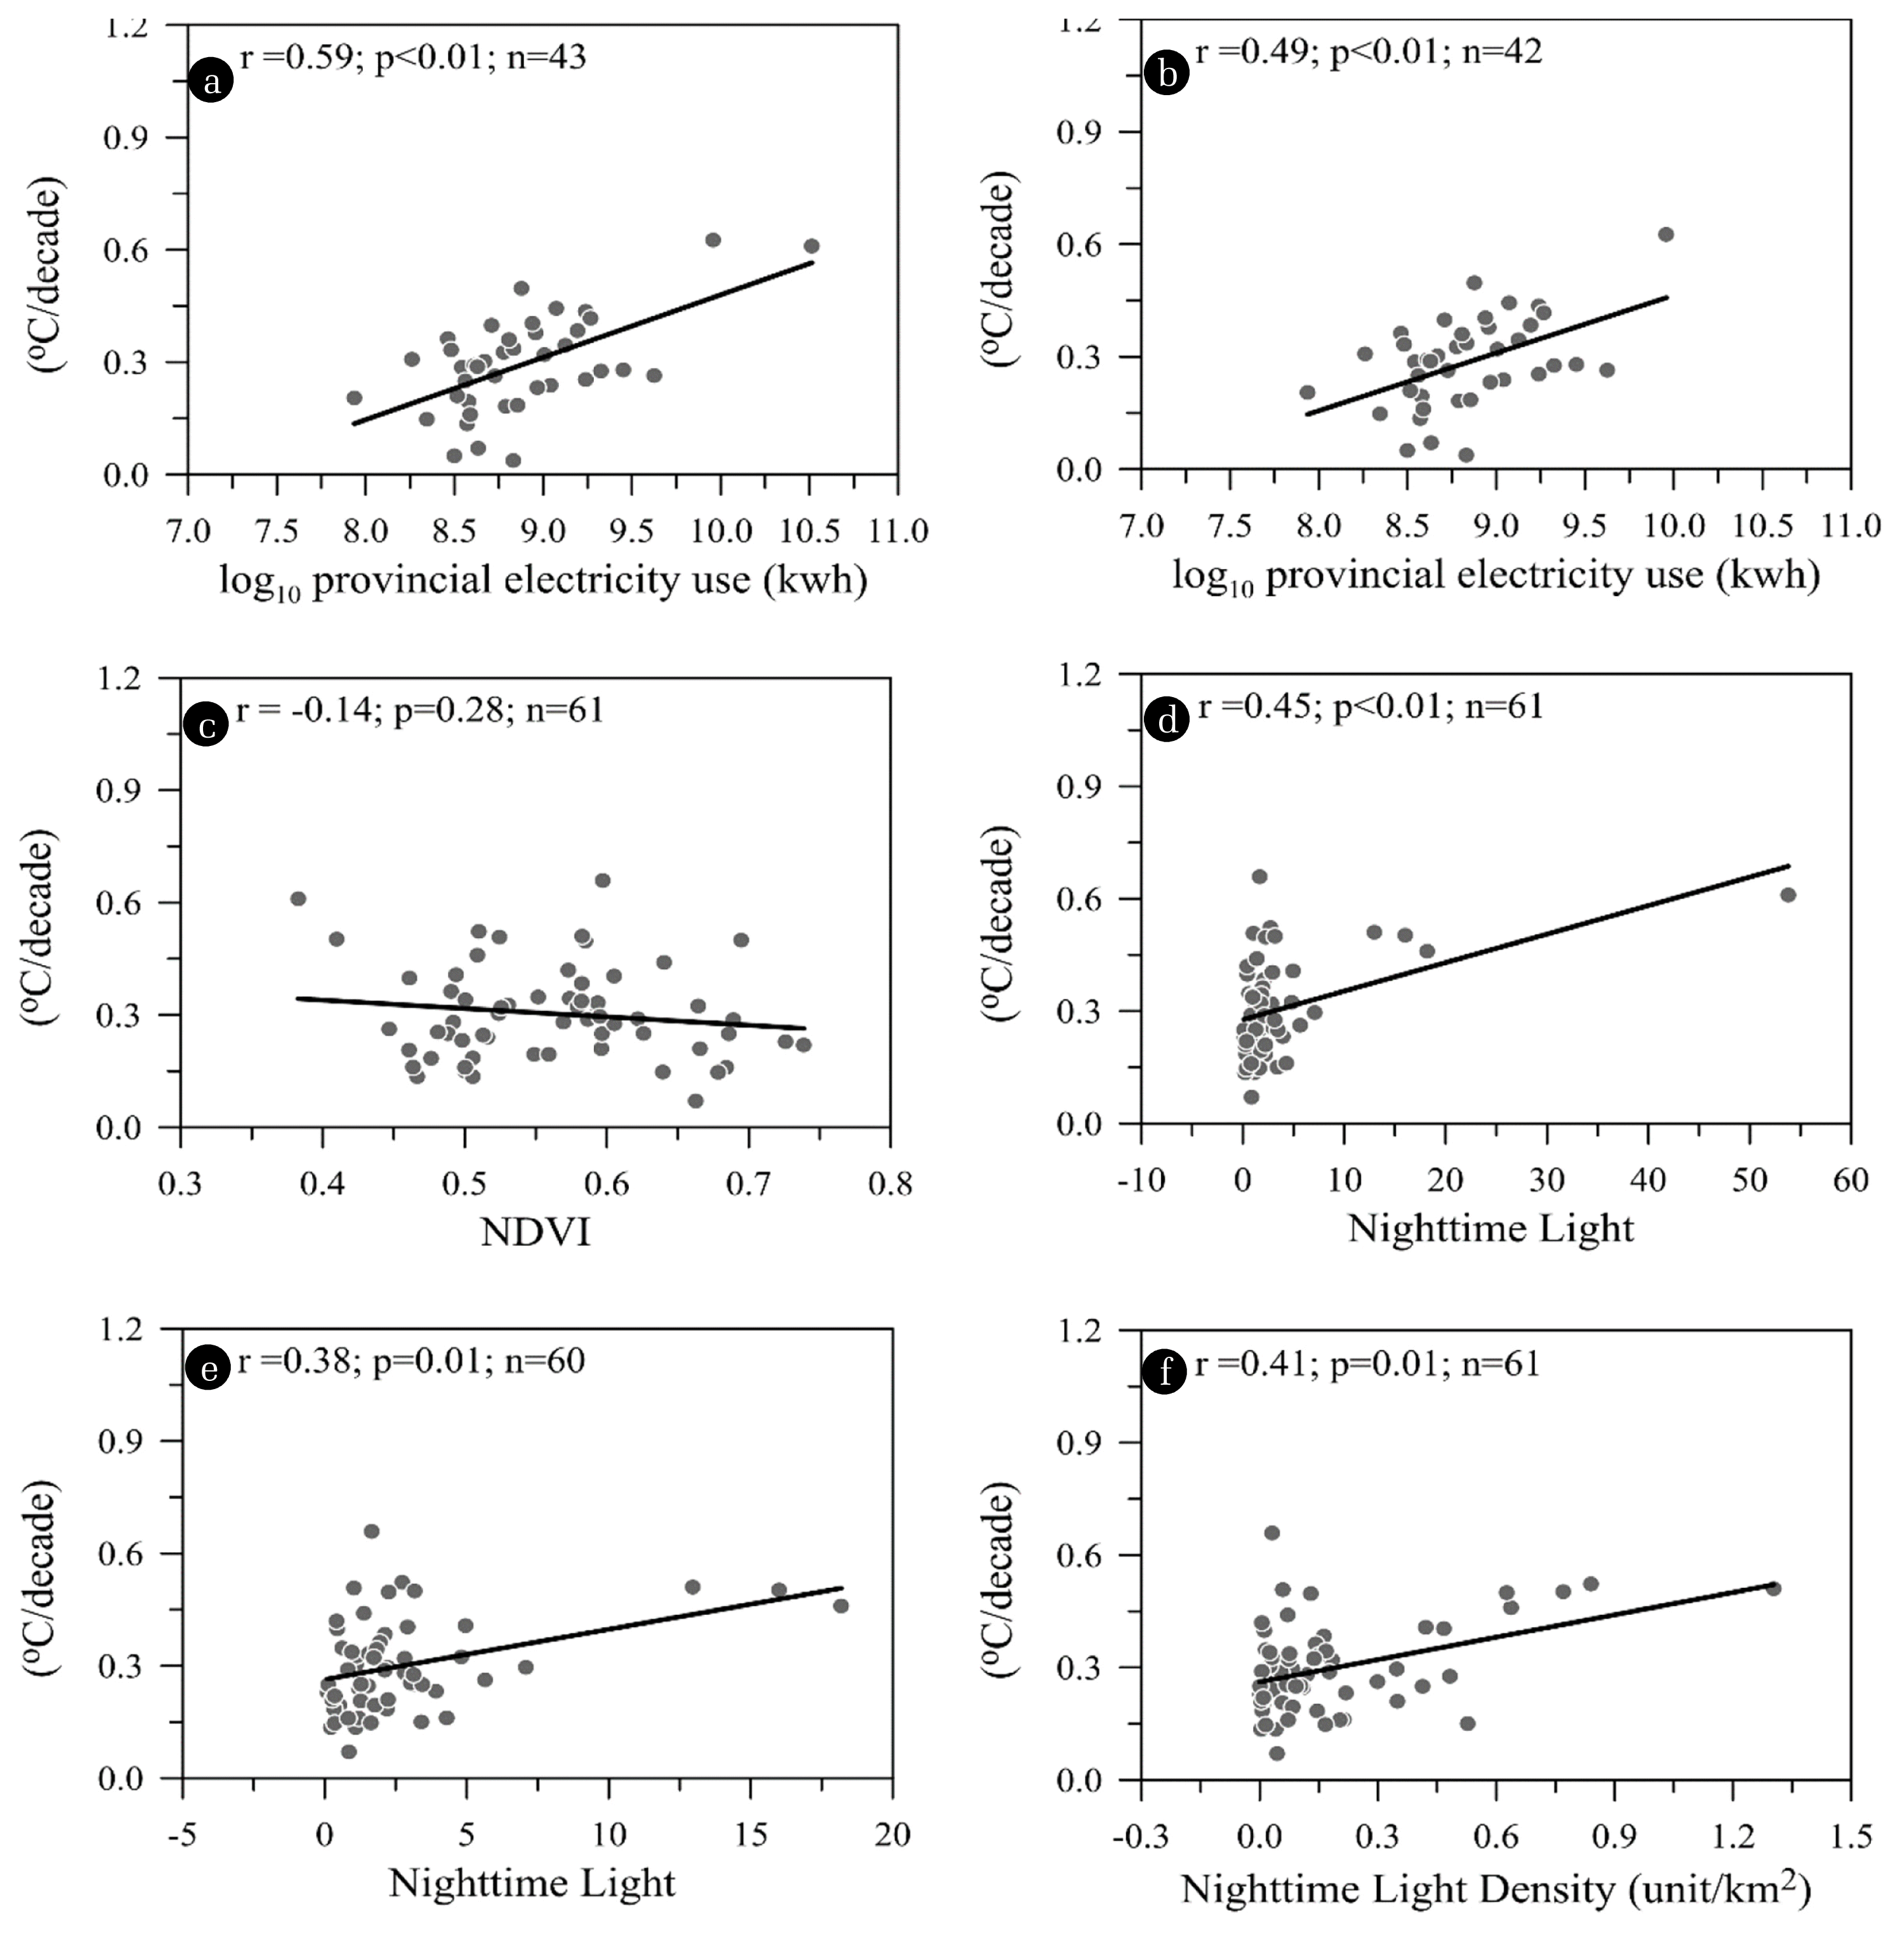
Correlations between observed annual Tmean trends and some selected urbanization-proxy variables which are electricity use, Normalized Difference Vegetation Index (NDVI) and Nighttime Light (NTL) are analyzed in order to provide additional evidence illustrating possible temperature trend-urbanization relationships in Thailand. The electricity use data downloaded from the website of National Statistical Office of Thailand [72] are available only for provincial-level values which are then averaged for the period 2006–2015. Whereas, the NDVI and NTL data are district-level averaged values for the shorter period 2017–2019 obtained from the project ‘Spatial analysis of inequality in Thailand: Applications of satellite data and Geographic Information System (GIS)’ which both of data are derived from Moderate Resolution Imaging Spectroradiometer (MODIS) and Visible Near-Infrared (NVIR) bands of the Defense Meteorological Satellite Program (DMSP) Operational Linescan System (OLS) [73]. The details of how these data have been processed and calculated can be found in Puttanapong et al. [73].
Analysis shows that annual Tmean trends in Thailand have good positive correlations with provincial electricity use, NTL and NTL density (Fig. 5). Their correlations are statistical significance at the 95% confidence level. It can be seen that the relationships between annual Tmean trends and provincial electricity use and NTL are overwhelmingly influenced by the exceptionally extreme Bangkok values (Figs. 5(a) and (d). After taking the Bangkok data out, however, correlations still hold significant (Figs. 5(b) and (e)). Note that the NTL density normalized by area shows significant positive correlation (r = 0.41, p < 0.01, n = 61) with annual Tmean trends (Fig. 5(f)), while negative but insignificant correlation is observed for NDVI (Fig. 5(c)). It is known that NDVI as the most commonly used vegetation index relates to an urbanized environment especially urban land cover types [74–77]. Higher NDVI values typically indicate a larger fraction of vegetation cover which in turn determines land surface temperature (LST) by the latent heat flux from surface to atmosphere through evapotranspiration [74, 75]. A negative correlation between LST and NDVI has been demonstrated by a number of studies [74–77]. In other words, the NDVI values tend to be low or even negative where LST is high and vice-versa. However, NDVI measurements are subject to seasonal variations and the LST-NDVI relationship is known to be nonlinear with predominantly bare soil locations experiencing a wider variation in surface radiant temperature than densely vegetated locations [74, 78, 79]. These factors in combination with shorter period data used here may cause insignificant correlation between annual Tmean trends and NDVI as shown in Fig. 5c. Our correlation analysis generally supports the results in the previous section, highlighting that the rising trends of annual Tmean in Thailand, to a certain extent, are proportional to increasing degree of urbanization of each city in recent years as indicated by electricity use and NTL. Our results are also consistent with the recent work showing that significant positive relationships between UHI magnitude and increasing nightlight luminosity are detected worldwide [16].
3.4. Urban-warming Adjusted Annual Tmean in Thailand
Our results demonstrate that the urbanization effects on station Tmean trends in Thailand have significantly increased the country-wide average Tmean trend. Thus, trend of national baseline Tmean and detection of regional climate change and attribution to large-scale natural and anthropogenic-induced factors can better analyzed, only when the urban-warming effect is removed. As the main weather stations for climate change study in Thailand are currently situated near and within cities, further attempt is to adjust the UHI effects on seasonal and annual Tmean data.
After the adjustment of the urbanization effects, a spatially coherent and widespread increase in annual Tmean with the number of stations showing significant trends as compared to the unadjusted data remains the same (Figs. 2(a) and 6(a)). However, the warming magnitudes of the adjusted annual Tmean reduce from 0.05–0.92°C per decade to 0.04–0.35°C per decade. As a result of substantial fraction of warming caused by the UHI effects, the warming trend for Thailand as a whole is brought down from the original 0.30°C per decade to 0.19°C per decade (Fig. 6(b)). The baseline annual Tmean warming is therefore merely 0.95°C over the 50 years. It is interesting to note that the increasing trend of annual Tmean in Thailand after adjusting urban-warming bias has the same rate as annual global mean temperature trend (Fig. 6(b)), reflecting a real country-level signal driven by large-scale anthropogenic-induced climate change. Country-wide average warming in all seasons after the UHI adjustment is also significant except in spring. Winter warming decreases from 0.37°C per decade to 0.27°C per decade while spring, summer and autumn increases drop from 0.21, 0.23 and 0.33°C per decade to 0.10, 0.14 and 0.26°C per decade, respectively. Therefore, the post-adjustment seasonal temperature trends indicate that the national baseline warming magnitudes in Thailand during the 50-year periods are 1.35°C for wintertime, 0.50°C for springtime, 0.70°C for summertime and 1.30°C for autumn, respectively.
4. Conclusions
Continued alternation in land surface resulting primarily from urban expansion undergone in the last decades has converted many weather stations in Thailand into suburban or urban setting. On the basis of the newly homogenized data and the UMR method, therefore, the urbanization effects on Tmean trends and their contribution to the overall warming in Thailand during 1970–2019 are analyzed. The study highlights that widespread significant warming observed in Thailand during 1970–2019 has been affected by urban land-use expansion. From a seasonal perspective, urban-warming contribution to the overall warming in Thailand is marked by the spring peak. This seasonal feature may be due to a shallow boundary layer produced by anthropogenic-generated heat and weaker local atmospheric circulations which are well developed during dry and hot boreal spring season. Across Thailand, annual urban warming exhibits a wide range of contribution to the overall warming, probably manifesting the UHI differences from city to city as a result of the varied urban characteristics and climatic background. For Thailand as a whole, urban warming contribution shows a significant increasing trend for the last 50 years, accounting for 40.5% of the overall warming. This evidence indicates that land use change especially urban expansion has great influence on surface warming, and the urban-warming bias contributes large fraction of observed rising temperature trends in Thailand. It is also evident that, for some large cities, the significant urban-warming contribution to temperature change is comparable to that of greenhouse gas concentration, suggesting that land-surface processes can play a vital role in shaping present and future climate change in Thailand. If such trends continue, certain large city areas may experience a rate of warming well beyond the range projected by regional climate models. The increasing trend of annual Tmean for the whole of Thailand after adjusting urban-warming bias is brought down to the same rate as the annual global mean temperature trend, reflecting a national baseline signal driven by large-scale anthropogenic-induced climate change.
Our results provide a scientific reference for policy makers and urban planners to mitigate substantial fraction of the UHI warming. Nevertheless, the UHI effects in Thailand still needs further research attention. The research should be focused at least on the mechanisms leading to the evidence observed in this study, the multiple drivers of UHI and their interactions within urban domains and heat stress and its impact. Therefore, extensive remote sensing observations will be needed in future work.