1. Introduction
The technological advancement greatly supported the healthcare sector. The devices developed for the efficient and selective detection of several medically important species is profoundly witnessed in improved quality of human life globally [1–3]. In a line the miniaturization of low-cost and robust detection devices are in greater demand for various healthcare units [4–5]. Further, variety of contaminants that enters into the biosystem through the aquatic environment is a serious concern for the developed or the developing nations. A suitable detection system could help in proper remediation of these contaminants from aquatic environment.
Arsenic is ubiquitous, naturally occurring, heavy metal and it is widely distributed in soil, sediment, water, aerosol, rain, aquatics and vegetations [6]. Arsenic is highly toxic and found carcinogenic and showed serious endanger to the human being exposed to it. Arsenic enters into the human body by two different possible pathways viz., by drinking arsenic contaminated water or by the consumption of plants that are cultivated in the arsenic contaminated soils [7]. It was reported previously that arsenic was detected in ground water in many countries around the globe and more than 200 million people are directly or indirectly exposed to it [8]. The hyperkeratosis on the palm or feet, bladder cancer and mutagenic effects is often occurs with arsenic consumption in humans [9–10]. Therefore, because of its acute toxicity, the U.S. Environmental Protection Agency (EPA) and World Health Organization (WHO) has recommended the maximum contaminant level (MCL) of arsenic is 10 ppb (130 nM) in drinking water [11–12]. Therefore, this compels to introduce newer analytical techniques having adequate reliability, extremely low detection limit and importantly robust in on-site detection of arsenic. This eventually, helps in safeguarding the human population living around this contaminated area and bound to consume the arsenic contaminated ground/fresh water. Several analytical methods were proposed in literature for the detection of low level of arsenic [12]. The surface plasmon resonance materials are found useful in the low level colorimetric detection of arsenic [13–15]. In this regard, the electrochemical methods are found prominent in the arsenic detection because of its reliability, low cost, easy handling and importantly the on-site use [16, 17]. Fluorine doped cadmium oxide thin film sensor was introduced. The sensor showed a detection limit and efficiency for arsenic is 4.55 × 10⁻³ ppb and 5.747 × 10⁻³ mA/ppb [18]. Role of advanced materials is impetus in fabrication of arsenic sensor. In a line, L-leucine modified graphene oxide (GO) was coated onto the gold electrode and utilized in the detection of arsenic(III). The results indicated that the sensitivity and detection limit of electrode was found to be excellent ~30 mA/ ppm/cm2 and of 0.5 ppm, respectively [1]. An electric discharge process at 1.2 kV was utilized to obtain the gold (NPs) followed by Au(NPs) and eutectic Au/Si alloy were (AuNPs) used for the graphite screen printed electrode [5]. The electrode was introduced in the arsenic detection showing the detection limit of 0.22 ppb however, a pre ion exchange resin is required in presence of copper. The linear sweep voltammetry was utilized in the low detection of As(III) using the graphite pencil electrode modified with tin oxide nanoneedles. The electrochemical system enabled to provide a detection limit 10 ppb at measured sensitivity of 28.13 μA/cm2/ppb [19]. Electrochemically etched gold wire microelectrode (Au-ME) was utilized in the low level detection of arsenic(III), arsenic (V) and total inorganic arsenic using the anodic stripping voltammetry. The impedance data revealed that a simple electrochemical reaction was taken place at Au-ME electrode having the electrode resistance of Re = 1.8 kW [21]. Bismuth modified exfoliated graphite electrode was introduced in the square wave anodic stripping voltammetry. The detection of As(III) was conducted at pH 6.0 and showed a LOD 5 mg/L. Further, the detection was affected with several interfering ions other than Cu(II) [20]. Hydrothermally Au–Cu bimetallic nanoparticles were obtained and utilized for the ultra-trace detection of arsenic(III) using the square wave anodic stripping voltammetry (SWASV). The detection of arsenic was almost unaffected in presence of several cations and the detection sensitivity and LOD was found to be 1.63 mA/ppb/cm−2 and 2.09 ppb, respectively [21]. These studies indicated that the use of advanced materials play an important role in the development of arsenic sensor for ultra-low level detection. The low cost materials with adequate efficiency and selectivity is useful in the advancement of sensor studies.
Therefore, novel nanocomposite precursor to natural bentonite is synthesized and it was first time utilized in the modification of carbon paste electrode. The electrochemical and impedance spectroscopy was studied and the nanocomposite electrode was further utilized in the ultra-trace detection of arsenic(III). The real matrix water sample was used in the efficient arsenic detection.
2. Experimental Section
2.1. Materials
The bentonite powder and sodium meta arsenite was obtained from the HiMedia Chemicals, India. Trichloro(octadecyl)silane, carbon (glassy spherical powder 2~12 mm) were obtained from the Sigma Aldrich, USA. Potassium chloride, potassium hexacyanoferrate(II) trihydrate, cadmium nitrate tetrahydrate and disodium hydrogen phosphate anhydrous were obtained from the Merck India. Ethylene diamine tetra-acetic acid was obtained from Qualigens Fine Chemicals, India and Manganese chloride was procured from SD Fine Chemicals Ltd. India. The purified water was obtained from the water purification System (Sartorius, Model-Arium Mini Plus UV Lab. Water System). All the chemicals were of Analytical grade and were utilized without further purification.
Electrochemical workstation (Potentiostat/Galvanostat; BioLogic Science Instruments, France, Model: SP 200) was employed to carry out the entire electrochemical/sensor studies. The electrochemical data was analyzed using in built computer software ECLab®. The Ag|AgCl was used as reference and platinum electrode was employed as auxiliary electrode in the three-electrode assembly. The working electrode was fabricated using the carbon powder and hybrid materials. X-ray diffraction (XRD) data was obtained by X-ray diffraction machine (PANalytical, Netherland; Model X’Pert PRO MPD). The data was recorded at the scan rate of 0.032 of 2θ illumination having the CuKα1 and CuKα2 radiations having wavelengths 1.5406 and 1.54443 Å. The FT-IR (Fourier Transform- Infra red), Shimadzu, Japan (model: IRAffinity-1S WL) was used to obtain the FT-IR data of solids. Atomic absorption Spectrometer (AAS) Shimadzu AAS, Japan (Model: AA-7000 Series) was used. Weighing balance Wensar, India (Model HPB220) was employed. Similarly, the Labtronics Microprocessor pH meter, India (Model LT-50) was used for pH measurements. The multi-parameter of water was obtained using the Hanna Instrument, USA (Model: HI98194). The TOC (total organic carbon) value of water obtained by the TOC analyzer, Shimadzu, Japan (Model: TOC-VCPH/CPN).
2.2. Methodology
Bentonite was grafted with trichloro(octadecyl)silane (TCODS). The bentonite was washed with distilled water and dried in drying oven at 105°C for 24 h. The dry and cooled bentonite (12 g) was dispersed in 300 mL of toluene and the suspension was stirred for 30 min under the N2 atmosphere. Further, under the stirred condition of this suspension, trichloro(octadecyl)silane (12 mL) was added slowly. The suspension mixture was refluxed at 80°C for 24 h under the N2 atmosphere. The solid was filtered using a Whatman filter paper and it was gently washed with toluene followed by ethanol. The TCODS grafted bentonite was dried in drying oven at 60°C for 24 h. It was then stored in air tight polyethylene bottle. The grafted bentonite (nanocomposite) was characterized by FE-SEM, FT-IR and XRD analyses.
The working electrode was fabricated using the carbon powder and the nanocomposite or pristine bentonite powder. The carbon powder and bentonite/hybrid material were taken in the ratio of 6:1 (w/w). Further, the powder of these two was mixed thoroughly and paste was prepared adding 1g of paraffin oil. The paste was manually introduced to pack a Teflon tube (5 cm in length and radius of 0.21 cm). The top of the tube is sealed with Teflon tape and then gently a titanium wire was inserted inside the tube to ensure proper electrical connectivity. The bottom end of the tube was kept open which was ready to use as working electrode. Further, at the completion of each cyclic voltammetry experiments, the open surface of tube was washed with distilled water, polished with glassy paper and again was used.
The electrochemical cell contained with the three electrodes viz., Ag|AgCl (satd.) reference electrode, Pt as auxiliary electrode and fabricated working electrode was used for electrochemical studies. The cell is closed and N2 was bubbled throughout collecting the electrochemical data.
2.3. Electrochemical Impedance Spectroscopic Analysis
The electrochemical impedance spectroscopic data was collected using the cyclic voltammeter employing the 1.0 mmol of ferrous/ferric cyanide solution having the background electrolyte concentration 0.1 KCl. The frequency range was used 80 kHz to 100 mHz with 6 points per decade at an employed 10 mV peak to peak sinusoidal potential. Further, in order to study the characteristics of electrode in the mass transfer reactions, the scan rate studies were conducted using 1.0 mmol of ferrous/ferric cyanide solution having the background electrolyte concentration 0.1 KCl varying the scan rate from the 50 mV/s to 200 mV/s.
A known concentration of arsenic(III) solution was prepared using the 0.1 mol/L KCl solution. The KCl solution pH was adjusted using the 0.1 mol/L HNO3 or NaOH solution. The cyclic voltammetric (CV) data was recorded at an exciting potential of +1.0 V and −0.2 V against an Ag|AgCl (satd.) reference electrode. The CV data was recorded for three consecutive cycles and the third cycle was utilized for further calculations. Moreover, six replicates were studied and hence the error was calculated and shown as ±3σ values. Further, anodic stripping voltammetry was employed for different electrochemical studies.
2.4. River Water Analysis
Water sample was collected from the Tlawng River, Aizawl (India). The multiparameter (conductivity, resistivity, salinity and oxidation reduction potential) of water quality was measured using multiparameter instrument. These parameters were obtained immediate after collecting the sample. The river water was analyzed for various elements using the AAS. Further, the NPOC (Non-purgeable Organic Carbon) of the river water was analyzed. The 0.1 mol/L KCl solution was prepared using the collected river water whose pH was previously adjusted. Further, this solution was spiked with the arsenic (III) to obtain the arsenic (III) concentrations 0.5 to 20.0 mg/L. The solutions were subjected for the anodic stripping electrochemical analysis and calibration line was obtained between the concentration of arsenic (III) and anodic peak current.
3. Results and Discussion
3.1. Characterization of Materials
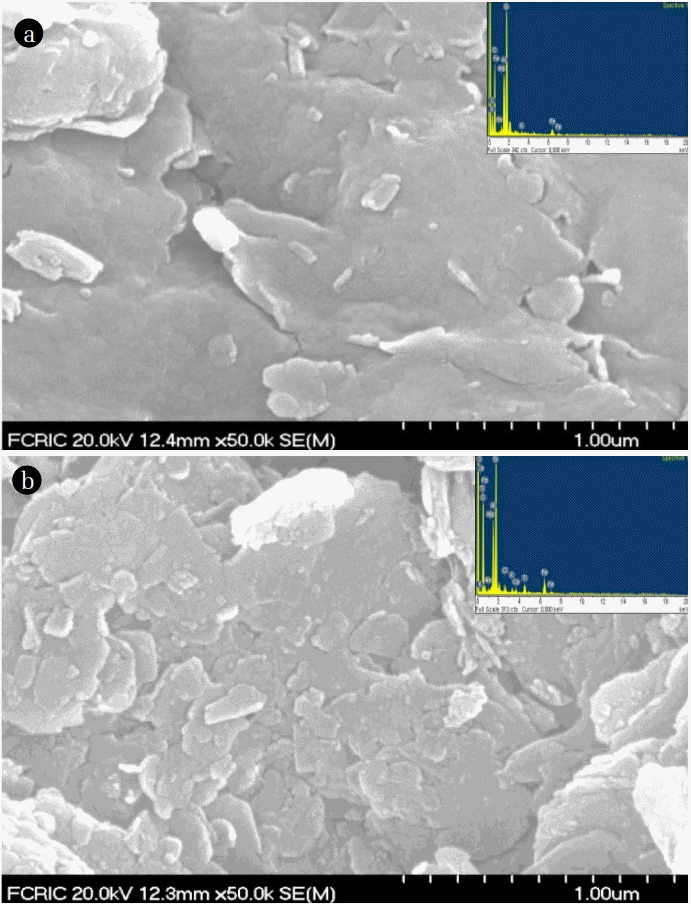
The SEM images of the bentonite and TCODS grafted bentonite (nanocomposite) is shown in Fig. 1. It is evident from the image that pristine bentonite possesses heterogeneous structure and silica content is visible on the surface of bentonite. Moreover, the layers of bentonite are orderly arranged on the surface. The porosity is evident by the pristine bentonite. On the other hand, the nanocomposite showed disordered structure and an enhanced heterogeneity was obtained on the surface of solid. It is evident that the silane molecules are occupying the places on the surface and likely to be grafted on the surface. The material is more compact and less porosity is visible. Similar results were reported previously when the 3-aminotriethoxysilane (APTES) was grafted with bentonite nano-clay and showed that the APTES is successfully grafted with bentonite [22].
Further, the EDX elemental mapping was conducted and EDX data is shown in Fig. 1 (Inset). The EDX mapping showed characteristic peaks of the Si, O, Fe, Mg, Na, C etc. A similar mapping was obtained for the nanocomposite. However, an additional but prominent peak of Cl is visible in the grafted clay. This indicated that the TCODS molecule was successfully grafted with the bentonite network.
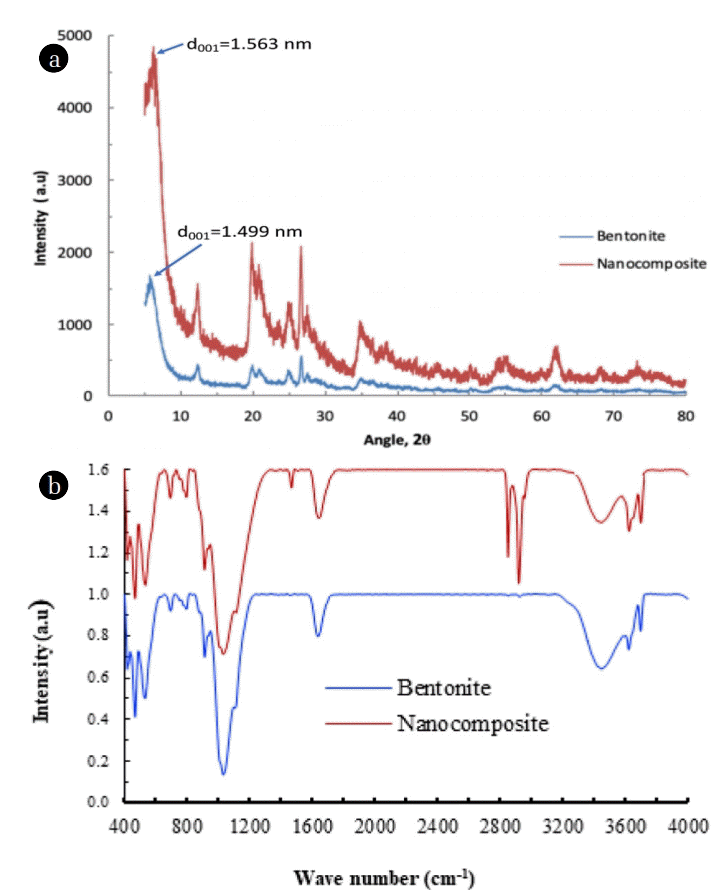
An x-ray diffraction spectrum of bentonite and nanocomposite is illustrated in Fig. 2(a). The figure showed that a good crystalline structure of bentonite is obtained in both the samples. The peak of (001) plane of pristine bentonite and nanocomposite occurred at the 2θ value of 5.89 and 5.65, respectively. Hence, the basal spacings d001 were obtained as 1.499 and 1.563 nm, respectively for the pristine bentonite and nanocomposite. It is evident from these values that the basal spacing of nanocomposite is not significantly enhanced compared to the pristine bentonite. This indicates that TCODS molecules are not entered into the galleries of bentonite rather forming the bond with the broken edges of bentonite [23].
The FT-IR spectra of pristine bentonite and nanocomposite are shown in Fig. 2(b). Figure indicated that both the samples possessed with broad peaks around 3,440 and 1,643 cm−1 wave numbers. These are due to the stretching and bending vibrations of -OH groups of bentonitic water molecules [23]. Further, a band around the region 1,190–940 cm−1 is primarily due to the vibrations of Si-O-Si or Si-O-Al [24]. Further, bentonite showed vibration bands around 1,105, 1,020 and 696 cm−1 are due to Si–O stretching vibrations. Moreover, Al–Al–OH hydroxyl-bending vibration is visible around 914 cm−1 [25]. Further, it is interesting to observe that the nanocomposite material showed two intense and sharp vibration peaks around the wave numbers 3039 and 2880 cm−1. This is due to the asymmetric and symmetric stretching of the C–CH2 group of the alkyl chain. Additionally, the scissoring oscillations of aliphatic organic chain were prominently occurred around the wavenumber 1489 cm−1. Therefore, this confirms the grafting of the organic silane with the bentonite network.
3.2. Electrochemical Impedance Spectroscopic Studies
The electrochemical impedance spectroscopy of the electrodes with Fe(II)/Fe(III) standard solutions were conducted at pH 6.4 using the background electrolyte 0.1 mol/L KCl. This eventually demonstrates the solid (working electrode) –electrolytic solution interfacial behaviour. The applied frequency range was used 80 kHz to 100 MHz with 6 points per decade at an employed 10 mV peak to peak sinusoidal potential. The measured imaginary impedance (Z¢) is plotted against the real impedance (Z). The results are shown in Nyquist plot (Fig. 3). Further, the equivalent circuits were drawn. The measured data was best fitted with the Randles circuit shown in Fig. 3 (Inset). The Randles circuit assumes the diffusional element (Warburg or Warburg short) which is connected in series with the charge transfer resistance [26]. Therefore, the equivalent circuit contained with the Rs i.e., a series resistance comes due to solution, wires or even contact resistances, Cd which is double layer capacitance at surface of electrode and electrolyte interface. The Rct is practically a charge transfer resistance which takes place at the electrode surface and bulk ionic species and W is the Warburg coefficient or Warburg diffusion impedance obtained because of diffusion of ionic species into the bulk solution [27]. The data is fairly fitted well to the Randles plot and the fitted values for bare carbon paste electrode and nanocomposite modified electrode are shown in Table S1. It is evident from the table S1 that the value of Rs which is primarily solution resistance was almost identical in both the working electrodes employed. Semicircle diameter of Nyquist plot determines the interfacial charge transfer resistance [28]. It is noted that the semicircle diameter is significantly decreased using the nanocomposite electrode which enabled to an efficient and faster redox reactions at the interface [29].
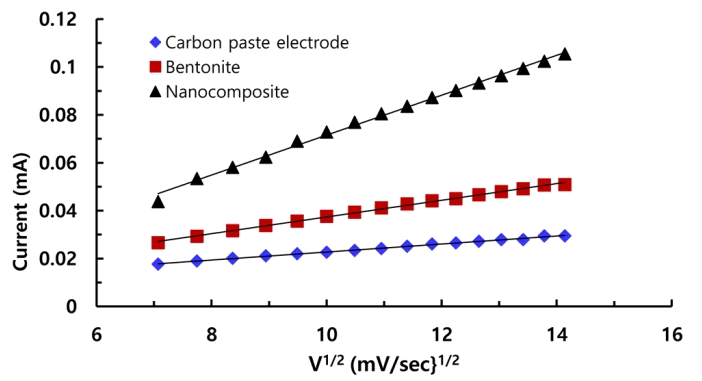
Further, electrochemical performance of the working electrodes viz., carbon paste, bentonite and nanocomposite were utilized in the redox reactions using the 1.0 mmol/L Fe(CN)63+/Fe(CN)64− redox probe under the cyclic voltammetry. The excitation of potential was increased from the 50 mV/s to 200 mV/s and the potential window was used −0.5 to 1.0 V. The results are presented graphically in Fig. S2. The hybrid materials modified carbon paste electrodes are then electrochemically characterized using the CV studies employing the 1.0 mmol/L Fe(CN)63+/Fe(CN)64− redox probe. The response with nanocomposite is significantly increased since the cathodic and anodic peak currents are significantly increased using the nanocomposite electrode. Therefore, the enhanced electrochemical signal received by using the nanocomposite inferred that nanocomposite material greatly facilitate the electron transfer reactions between the Fe2+/Fe3+ at the surface of electrode [30, 31]. The mass transfer reactions at electrode-electrolyte are studied using the Randle–Sevick equation [30, 32]. The results are depicted in Fig. 4. A linear relationship between the peak current and the square root of scan rate suggested clearly the interfacial kinetics is diffusion controlled [20]. Further, using the slope of these lines and the diffusion coefficient of Fe(CN)63−/Fe(CN)64− (cm2/s) in aqueous media 7.3 × 10⁻⁶ cm2/s, the electroactive surface area of these working electrodes were computed. The electroactive surface area of carbon paste, bentonite and nanocomposite electrodes are found to be 7.40 × 10⁻³, 1.52 × 10⁻² and 3.61 × 10⁻² mm2, respectively. It is interesting to note that the surface area of nanocomposite is 4.88 times higher than the carbon paste electrode and it is 2.37 times higher than the pristine bentonite electrode. This significant increase in electroactive surface area using nanocomposite electrode could enable to detect the arsenic (III) even at ultra-trace level. A similar diffusion controlled kinetics was suggested for the As(III) using the bismuth modified exfoliated graphite (EG-Bi)working electrode and reported that electroactive surface area was found to be 13.1 mm2 and 16.3 mm2, respectively for EG (exfoliated graphite) and EG-Bi electrode, respectively. [21].
3.3. pH Dependence Electrochemical Studies of Arsenic (III)
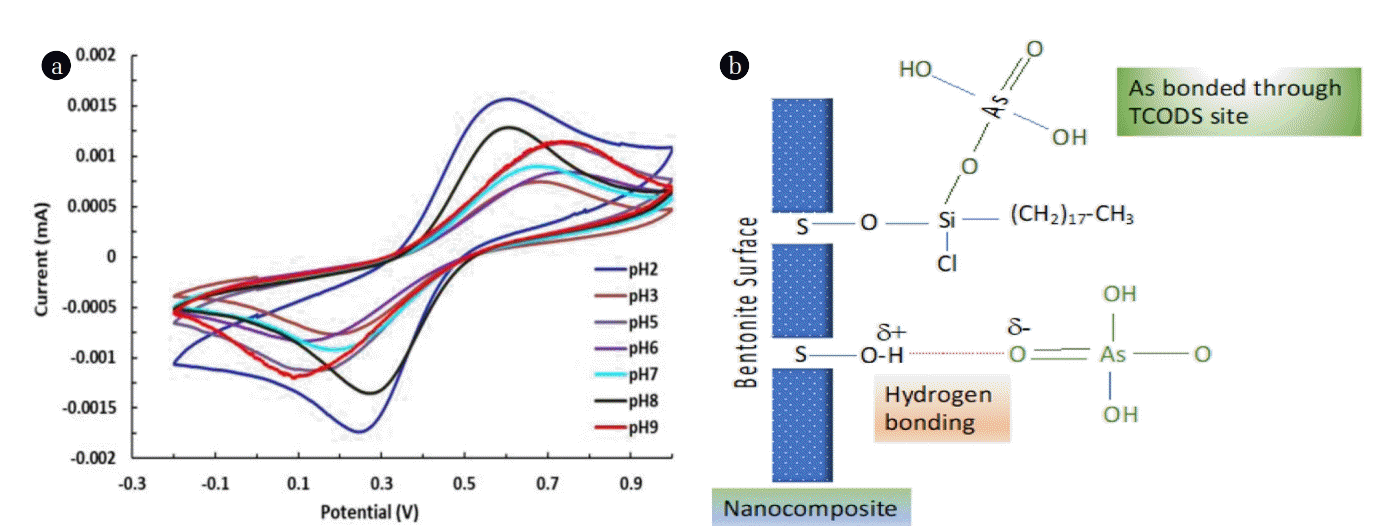
The cyclic voltammograms of arsenic (III) was obtained at various pH values and shown in Fig. 5(a). It is evident from the figure that the arsenic possessed a characteristic anodic and cathodic peaks around the applied potential of 0.61 and 0.25 (vs Ag|AgCl), respectively (at pH 2.0). The arsenic concentration was chosen as 30.0 μg/L. Moreover, the cathodic and anodic peaks are sharp and smooth. This infers that arsenic (III) undergoes with a single step 3 electron oxidation and reduction processes i.e., As(III) reduced to As(0) and As(0) oxidized to As(III). It was reported previously that the arsenic (III) was reduced in a single step process around applied potential of −150mV and oxidized around 50 mV using the bismuth modified exfoliated graphite (EG-Bi) working in a 0.1 M KNO3 (pH 6) [21]. The information obtained from the CV was used to determine the preconcentration potential. The observed ΔE value is found to be 0.36 V. Hence, the observed low value of ΔE indicates that the redox process of arsenic is greatly favourable at the nanocomposite electrode [33]. The other studies showed that As(III) shows no redox reactions on to the CNTs (carbon nanotube) electrode however, gold-CNTs electrode showed a dominant cathodic peak at the potential −0.25V (vs SCE) and it was regarded 3 electron reduction of As(III) [34–35].
Further, the solution pH is an important parameter to be studied since the speciation of arsenite varies with pH [36]. As(III) exists predominantly within the pH region 2~8 to its non-ionic form i.e., H3AsO3 which gradually turns to anionic species of H2AsO3− beyond pH 8. On the other hand, the nanocomposite possessed the pHPZC value of 6.84. Therefore, the nanocomposite carries net positive charge at pH < 6.84 and pH > 6.84 it possess net negative charge. The response of the pH dependence studies shown in Fig. 5(a); clearly shows that the electrochemical behaviour of arsenic(III) is almost similar at different pH values, however, the peak intensity and peak positions are greatly affected by varying the solution pH. Increasing the pH, the cathodic and anodic peak positions are greatly shifted with an enhanced ΔE values. The increased ΔE values make the redox process more non-favourable. However, at pH 2.0 the ΔE was found as low as Ca 0.34 V with significantly high current density. A similar observation was obtained for As(III) as the high current density was obtained at lower pH values using the EG-Bi electrode [21]. Low electrochemical signal received at higher pH conditions is possibly due to hydroxide formation that hinders the arsenic detection. Therefore, in view of the surface properties a possible mechanism of arsenic was proposed. It assumes that arsenic adsorbed on the surface of nanocomposite with relatively strong chemical bonds at the electrode surface and giving enhanced signal of cathodic or anodic peaks. The bonding sites are, possibly, having of two types as depicted in Eq. (1) and (2):
It is therefore evident that a chemical bonding is taken place between the nanocomposite arsenite molecules which undergoes redox reactions at the surface of solid [37]. The other possibility is due to the presence of unoccupied bentonite surface site. The surface is likely to form a strong hydrogen bond with the arsenite molecule (Eq. (2); Fig. 5(b)) [38]. Therefore, presence of arsenite on the electrode surface either by the chemical bonding or by the hydrogen bonding enabled efficiently the redox process to take place at the surface. Hence; an enhanced electrochemical signal was received.
3.4. Anodic Stripping Voltammetry for Arsenic (III) Calibration
The electrochemical response of arsenic(III) using the bare carbon paste, pristine bentonite and nanocomposite modified working electrodes is conducted having the As(III) concentration 50.0 μg/L at pH 2.0 in 0.1 mol/L KCl solution. The results are illustrated in Fig. S3. It is evident from the figure that the cathodic and anodic peak currents are significantly increased using the nanocomposite modified carbon paste electrode. The bare carbon paste electrode or pristine bentonite modified carbon paste electrode showed, not only, much reduced electrochemical signal as well the cathodic and anodic peaks of As(III) oxidation/reduction are invariably disordered. The results clearly showed the significance and potential of nanocomposite in the low level detection of As(III) from aqueous solutions.
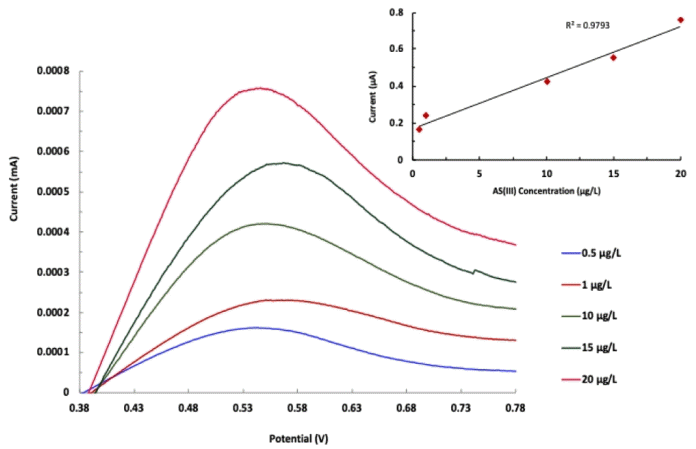
The As(III) detection was carried out using the anodic stripping voltammetry at the applied potential of 0.4 to 1.0 V. The stripping voltammetry is a useful electrochemical tool since it provides precisely low detection limit [39]. Moreover, the selectivity and sensitivity of detection is enhanced using the stripping voltammetry. Therefore, the anodic stripping voltammetry curves were obtained varying the concentration of As(III) from 0.5 mg/L to 20.0 μg/L at pH 2.0 in 0.1 mol/L KCl employing the nanocomposite electrode. The results are depicted in Fig. 6. It is evident from the figure that an increase in concentration of As(III) caused to increase the anodic peak current. Further, the calibration line was obtained between the anodic peak current and As(III) concentration. The results are shown in Fig. 6 (Inset). Figure showed that fairly a good linearity was obtained between the anodic peak current and As(III) concentration. Further, the linear regression of straight line was obtained and the obtained equation is IA(mA) = 0.0276 × C(μg/L) + 0.168 (R2= 0.979). The results indicated that the detection of arsenic is efficiently obtained even at very low concentration of arsenic in aqueous media. Limit of detection (LOD) and limit of quantification (LOQ) was further obtained using the known Eq. (3) and (4), where ‘s’ is standard deviation of blank solution and ‘m’ is the slope of the calibration line.
The LOD for six replicates was obtained to be 0.00360 ± 0.00002 μg/L. Similarly, the LOQ was calculated as 0.0120 ± 0.0003 μg/L. The LOD is found to be much below to the EPA limit of arsenic in the fresh water that enables greater applicability of analytical method. Moreover, the replicates of data showed a good reproducibility of results as the observed relative standard deviations (RSD) was obtained always less than 4%. The results obtained are compared with the other literature findings and returned in Table 1. The LOD obtained in the present study is found reasonably lower than those reported previously as in Table 1 and hence could have potential implication in the detection of arsenic in the water bodies.
3.5. Presence of Co-existing Ions
The influence of several co-existing ions was also studied in presence of 150 μg/L of each interfering ions. The As(III) concentration was taken 2.826 μg/L in 0.1 mol/L KCl. The interfering ions were chosen as cadmium (II), chromium (VI), copper (II), manganese (II), phosphate and EDTA. The anodic stripping voltammetry curves are represented in Fig. S4. It is evident from the figure that no significant interference was occurred in presence of cadmium (II), chromium (VI), phosphate and EDTA. However, presence of copper (II) and manganese (II) caused to enhance the anodic peak signal and hence interfering the As(III) detection. Possibly the copper and manganese were oxidized at the same potential and hence, the anodic peak current was increased. The quantitative estimation of As(III) in presence of these co-existing ions are shown in Table S5. The Au/GO/Leucine/Nafion electrode showed no interference in presence of Zn2+, Pb2+, Hg2+and Cd2+ both having same concentration of 10 ppm [1]. Similarly, the detection of As(III) in presence of Pb2+, Co2+, Ni2+, Cd2+, Cu2+, Zn2+and K+ is not affected significantly using the F-doped CdO electrode [18]. However, the presence of Pb2+, Hg2+ and Cu2+caused a reduction of stripping current by 10, 30 and 65% for As(III) using the gold ultramicro electrode [42].
3.6. Detection of As(III) in River Water Sample
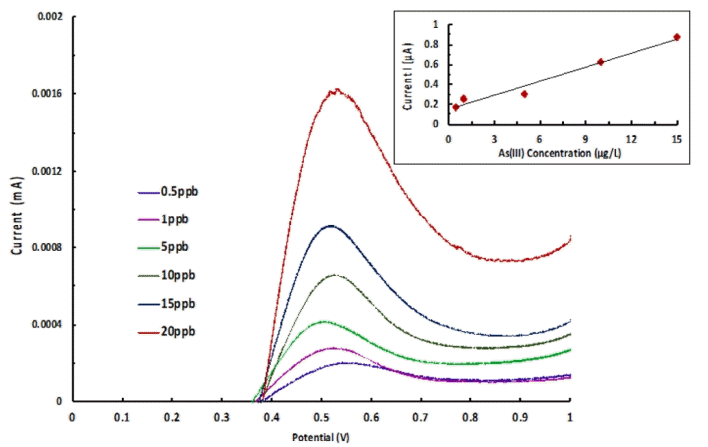
The intention of study was the implication of analytical method for the real matrix analysis of arsenic. The physico/chemical nature of river or ground water is found complex and it changes with time and space. The water quality is greatly affected by the temperature, human intrusion, microorganism activities or even the nature of soil and rocks [15]. Therefore, a real matrix analysis enables us to find suitability, selectivity and feasibility of analytical method. Hence, the water was collected from the Tlawng River, Aizawl, India and employed without any filtration or purification. However, the river water sample was subjected for various physico-chemical analysis. The results are appended in Table S6. The results indicated that the water is free from several heavy metals however; it contained with Ca, Zn and Fe. On the other hand, the high value of inorganic carbon and some NPOC is present. Further, the river water was spiked with varied concentrations of arsenic (III) at pH 2.0 in 0.1 mol/L KCl background electrolyte. Further, the anodic stripping voltammetric analysis was conducted and results are shown in Fig. 7. It is evident that smooth curves are obtained and on increasing the concentration of As(III), the anodic peak current was increased gradually. Further, a regression line between the As(III) concentration and anodic peak current was plotted and shown in Fig. 7 (Inset). The regression line was obtained as y = 0.0469 × + 0.1523 (R2 = 0.9719). Reasonably a good linearity was obtained between the concentration and anodic peak current. Interesting to note that the RSD was always found less than 4%. Further, an unknown solution of As(III) having known concentration 5.0 μg/L at pH 2.0 in 0.1 mol/L KCl was prepared in the same river water and subjected for the anodic striping analysis. Further, using the regression line, the As(III) concentration was estimated and found to be 4.9 ± 0.02 μg/L. This indicated that the recovery was more than 98%. These results indicated that the devised method is useful in precise and efficient detection of arsenic at ultra-trace level. It provides fairly a good selectivity and sensitivity. The SnO2/Nafion/C pencil electrode has shown fairly good applicability in qualitative and quantitative detection of As(III) from industrial waste water samples [19].
4. Conclusions
Novel silane grafted bentonite (nanocomposite) was synthesized using simple non-aqueous grafting method. The XRD data showed that silane was successfully grafted at the edges of bentonite and the IR data enabled to show vibration peaks around wave numbers 3,039 and 2,880 cm−1 which is due to asymmetric and symmetric stretching of the C–CH2 group of the alkyl chain and a scissoring oscillations of aliphatic organic chain was occurred around the wavenumber 1,489 cm−1. SEM morphological studies showed heterogeneous structure of nanocomposite and silanes molecules are visible on bentonite surface. Further, the nanocomposite material was employed in the electrochemical detection of As(III). The impedance spectroscopic data revealed for Nyquist plot and the equivalent circuit fitted to the Randles plot. The electroactive surface area was found to be 7.40 × 10⁻³, 1.52 × 10⁻² and 3.61 × 10⁻² mm2, respectively for the carbon paste, bentonite and nanocomposite electrodes. pH dependence studies indicated an enhanced electrochemical signal was obtained at pH 2.0 with a minimum ΔE values. The sensor studies enabled to low level detection of As(III) with a LOD 0.00360 μg/L. The observed RSD were found less than 4%. The presence of several cations and anions could affect the detection of As(III). However, a marked deviation was observed in presence of Cu(II) and Mn(II). The nanocomposite showed fairly good selectivity and sensitivity using the river water samples as spiked with As(III). The proposed method is a useful analytical method to be employed for the ultra-trace and, perhaps, on site detection of arsenic.


