1. Introduction
Activated sludge process (ASP) is one of the primitively developed methods for treating wastewater containing a high concentration of suspended or dissolved organic solid [1, 2]. A full-scale industrial ASP is a complex process and the hydrodynamic performance of industrial ASP is a major issue for the industries [3, 4]. ASP is a combination of two vessels connected in series, a mixing tank, and a settling tank often termed as an aeration tank (AT) and a secondary clarifier, respectively. The operation of both the vessels entirely varies from one another. The AT is a bio-reactor that comprises of a predetermined population of microorganisms maintained at aerobic conditions. The microorganisms facilitate the removal of dissolved and particulate organic matter and hence stabilizing the pollution load of the effluent [5]. The microorganism dis-integrates the organic matter into simple products (CO2 and H2O) and biomass. The biomass generated in the AT is separated in the clarifier that deposits at the bottom of the clarifier to form slurry that can be conveniently recycled back to the AT to maintain the desired mixed liquor suspended solids (MLSS).
The ASP of a full-scale industrial effluent treatment plant accounts for 40–60% of its total power consumption [6]. Non-uniform flow in the ASP can result in anomalies like stagnant zones, bypassing, high recirculation rate, abnormal flow paths and inefficient mixing. Hydrodynamics of such intricate systems and processes can be examined using the residence time distribution (RTD) technique [7–9]. RTD is a well-established method that has been applied form many decades to study the hydrodynamics of complicated industrial systems [10–13]. Several RTD studies performed on ASP shows that the AT acts as a complete mixing tank and excessive air supply is needed to ensure the aerobic condition, provided by air diffusion systems or surface aerators. The rate of aeration often leads to high circulation rates and back-mixing, and affect the sludge particle size and its distribution in the reactor [14–16]. These reactors have been often represented with one parameters and two parameters RTD models [17, 18]. However, the ASP involves several combinations of complex physical, biological and chemical processes [19], conventional RTD models as tank-in-series (TIS), axial dispersion model reported in the literature fail to provide a comprehensive view of the performance of ASP [20, 21]. Compartment models are a combination of discrete reactors (CSTR and PFR) connected in a different configuration to provide a global approach to view of the hydrodynamic performance of the ASP and provide critical information for optimizing the plant operation [22–24].
The ASP is a bio-reactor and RTD study alone is not sufficient for a comprehensive interpretation of the system. The majority of RTD performed on the ASP, the impact on biological treatment efficiency with mean residence time (MRT) of effluent in the system has been largely neglected and the performance has been evaluated in terms of basis inflow and outflow condition of the system alone [5, 25–27]. Although discrete studies to evaluate the substrate removal efficiency by analyzing the effect of various parameters for AT of ASP has been performed [28–30] but the combined studies evaluating the hydraulic and biological performance of ASP has been limited.
We had an opportunity to perform industrial scale RTD experiment on a pulp and paper mill ASP [31, 32]. However, it was impractical to change the operating parameters in a full-scale industrial system. Hence based on the industrial experiment a pilot scale ASP was constructed to study the effect of MRT of the effluent in the system and sludge recycle ratio, on the hydrodynamic efficiency and biological treatment efficiency of the system.
RTD experiments were performed for 4 sets of MRT (14, 16, 20 and 24 h) with no sludge recycle and then recycle of 10% and 20% in the AT using LiCl salt as a tracer. The substrate concentration (Biochemical oxygen demand (BOD) and Chemical oxygen demand (COD)) at the inlet and outlet of the AT and secondary clarifier were also monitored to observe the biological treatment efficiency along with the hydrodynamic efficiency of the tank. Appropriate empirical models were suggested to represent the flow behavior of the AT and ASP using compartment modelling technique at different operating parameters. The objective of the study was to analyze the hydrodynamic and biological performance of the ASP at different MRT and recycle rates and propose flow models to describe the physical behavior of the system and determine the optimum flow condition in the AT and complete ASP.
2. Methodology
2.1. Wastewater
Real-time effluent was collected from the overflow of the primary clarifier from an indigenous pulp and paper industry in India (M/s Shreyans Industries Ltd., Ahmedgarh, Punjab, India). The characteristics of the effluent were (mg/L) BOD 540–580, COD 1,050–1,150, MLSS 2,800–3,500 and pH 7–7.66. The effluent was stored at 3°C before it was used for the experiment. The microbial seed for the AT was collected from the industry and aerated for 24 h at room temperature before inoculating the reactors.
2.2. ASP System
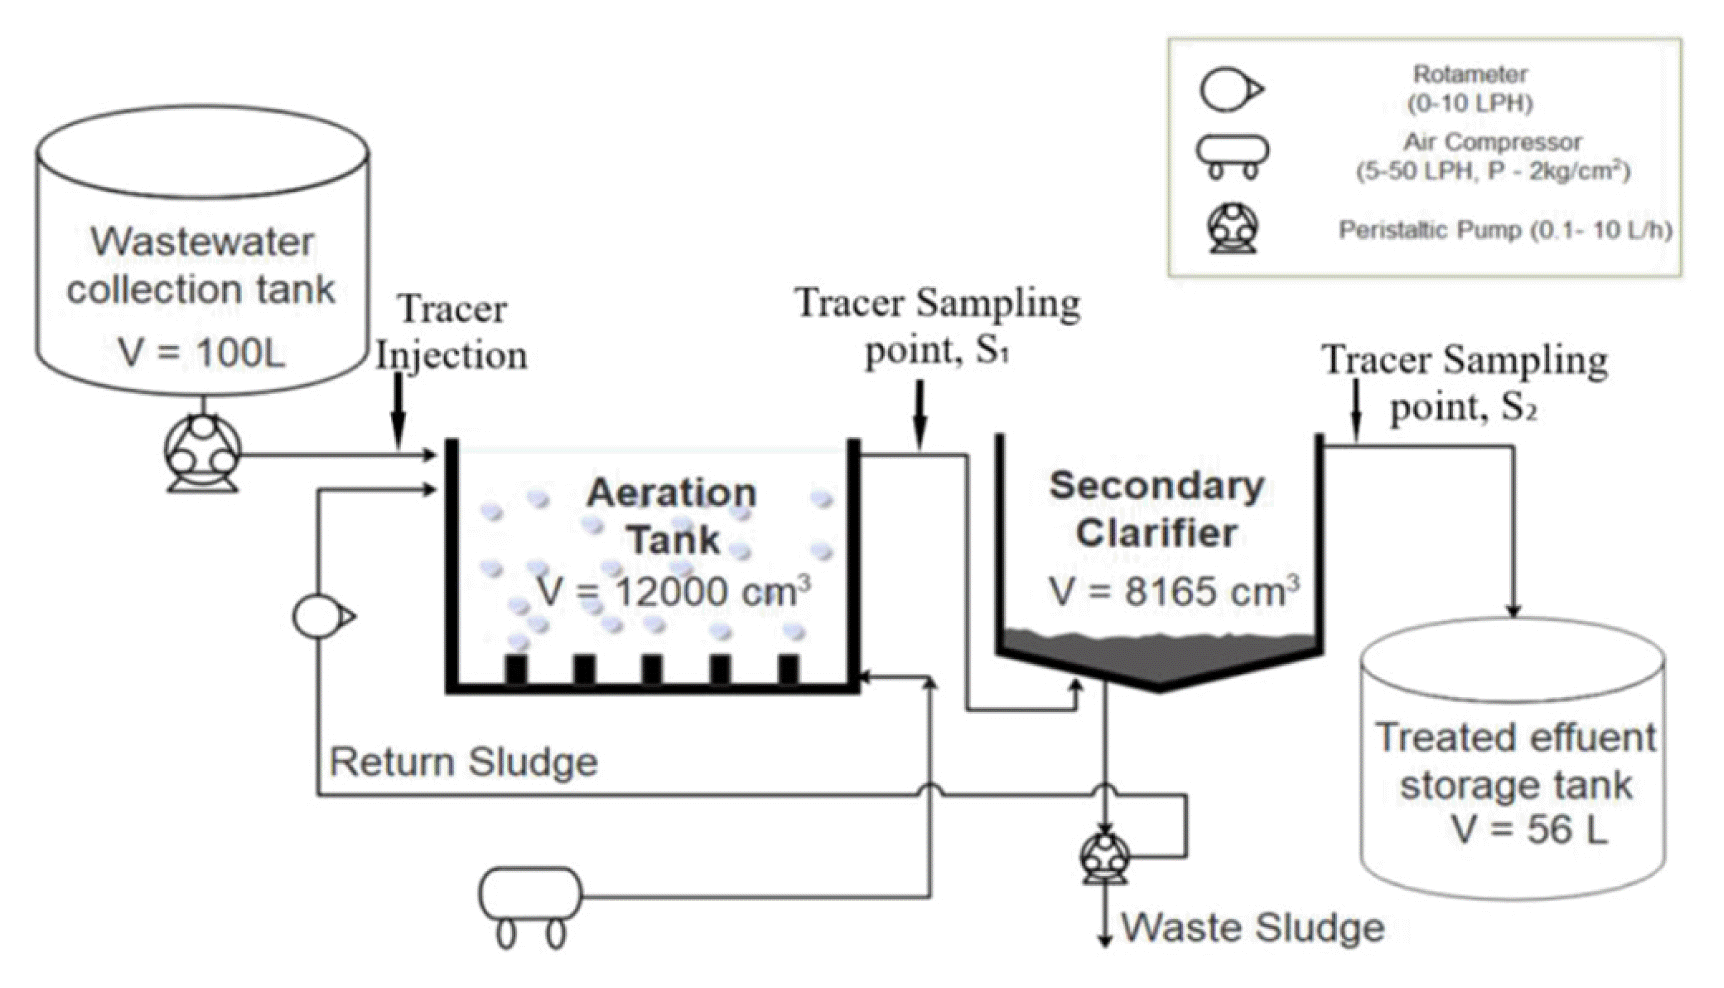
The schematic diagram of the pilot scale ASP system has been shown in Fig. 1. The AT was a stainless steel tank having dimensions 60 × 15.5 × 15 cm with a working volume of 12,000 cm3. Diffused aeration system was set in the AT by fitting perforated tubes of diameter 0.5 mm along the length of the tank to provide aeration. An oil-free compressor was attached to the aeration line through a rotameter to regulate air flow in the system and maintain the desired dissolved oxygen (DO) level in the AT. Outlet channel of the AT is connected to the clarifier. The clarifier was a long cylindrical tube of diameter 15.2 cm and height 45 cm. The inlet, outlet and recycle line of the ASP are connected with 0.5 cm pipes. Two peristaltic pumps (capacity 0.1–10 L/h) synchronized to a control panel were used to pump the effluent from storage tanks to the AT and the recycle stream from the bottom of clarifier to AT, respectively.
2.3. Methods
2.3.1. RTD experiment of tracer
Analytical grade Lithium chloride purchased from Loba Chemie Pvt Ltd. was used as a tracer for the RTD study. Lithium Chloride (LiCl) is the most common salt used for tracing applications [3]. Lithium chloride is preferred over other tracers for wastewater treatment plant unit studies because it is not a normal component of wastewater. LiCl is inert in nature and does not react with anything in the wastewater system, and it is easily detected by basic analytical methods. The recovery rate of LiCl is more as compared to fluorescent dyes [33]. Also, the use of fluorescent dyes as a tracer for colored wastewater (pulp and paper effluent) is not suitable. It was observed that the concentration of lithium chloride above 15% can hinder the microbial growth in the AT [34]. Hence, the toxicity of LiCl concentration on the growth of the microorganism population in the AT was examined by the Kirby Bauer method [35, 36] and based on this study, the concentration of LiCl was kept below 15% for all the experiment, for all the RTD experiments. A 10% LiCl salt solution was prepared in 100 mL of water and instantly poured at the inlet of the AT. The tracer was injected by an impulse input method. The concentration of LiCl was monitored at the outlet of AT (sampling point S1) and overflow outlet of secondary clarifier (sampling point S2) initially at an interval of 10 min and then at an interval of 1 h. The concentration of LiCl was measured using the conductivity method. The conductivity of the LiCl was measured at the outlet of the AT and secondary clarifier. The measured values were compared to the conductivity vs LiCl concentration standard curve was drawn for 1% to 20% concentration of LiCl with every 2% increase. The recycle concentration of sludge to the AT was varied and two more sets of RTD experiment were performed for concentration of LiCl (CLi+) vs time (t) curve and modelled to obtain suitable hydrodynamic models for the system. The RTD curve was obtained by calculating the ELi+ (t) for each set of experiment according to Eq. (1) [16]:
For an impulse injection of tracer at the inlet of the system, the effective MRT of the effluent in the system was calculated with Eq. (2) [16]:
2.3.2. RTD Modelling
The RTD software DTS PRO-V4.21 developed by PROGEPI [37] was used for simulation of the RTD data obtained for the AT and completes ASP. The software offers the possibility for the users to build any physically representative model for the system under investigation and subsequently use the same to simulate the experimentally measured data. Convention tanks-in-series model and compartment models were used. In Tanks-in-series model the reactor was divided into a number of perfectly mixed tanks (N). For N = 1 an ideal CSTR is modelled, whereas for N = infinity a PFR behaviour was obtained. Compartment models predicted for the reactors were based on the combination of ideal CSTR and PFR arranged in different configurations. The parameters of the compartment model were adjusted and multiple simulations were performed such that the model curve corresponds to that obtained from the experimentally obtained RTD data. The parameters were used to predict the macroscopic flow model and mixing pattern in complex systems as the ASP. The structure of the compartment model resembled as closely as possible the actual flow pattern of the reactor.
2.3.3. Parametric Assessment
Samples were withdrawn at the beginning and end of the experiments and monitored at the outlet of the AT and overflow of the secondary clarifier. During the experiments, the ASP was operated continuously for six months with regular sampling to determine the physio-chemical parameters of the system. The laboratory analyses on composite samples of wastewater comprised total COD, total BOD5, TDS, TSS, and pH were conducted following standard methods [38]. The efficiency of substrate decay in the AT and complete ASP was determined by the Eq. (4) [39]:
Where So and S are the substrate concentration at the inlet and outlet sampling points calculated in terms of BOD and COD.
3. Results and Discussion
3.1. Hydraulic Performance of AT and ASP
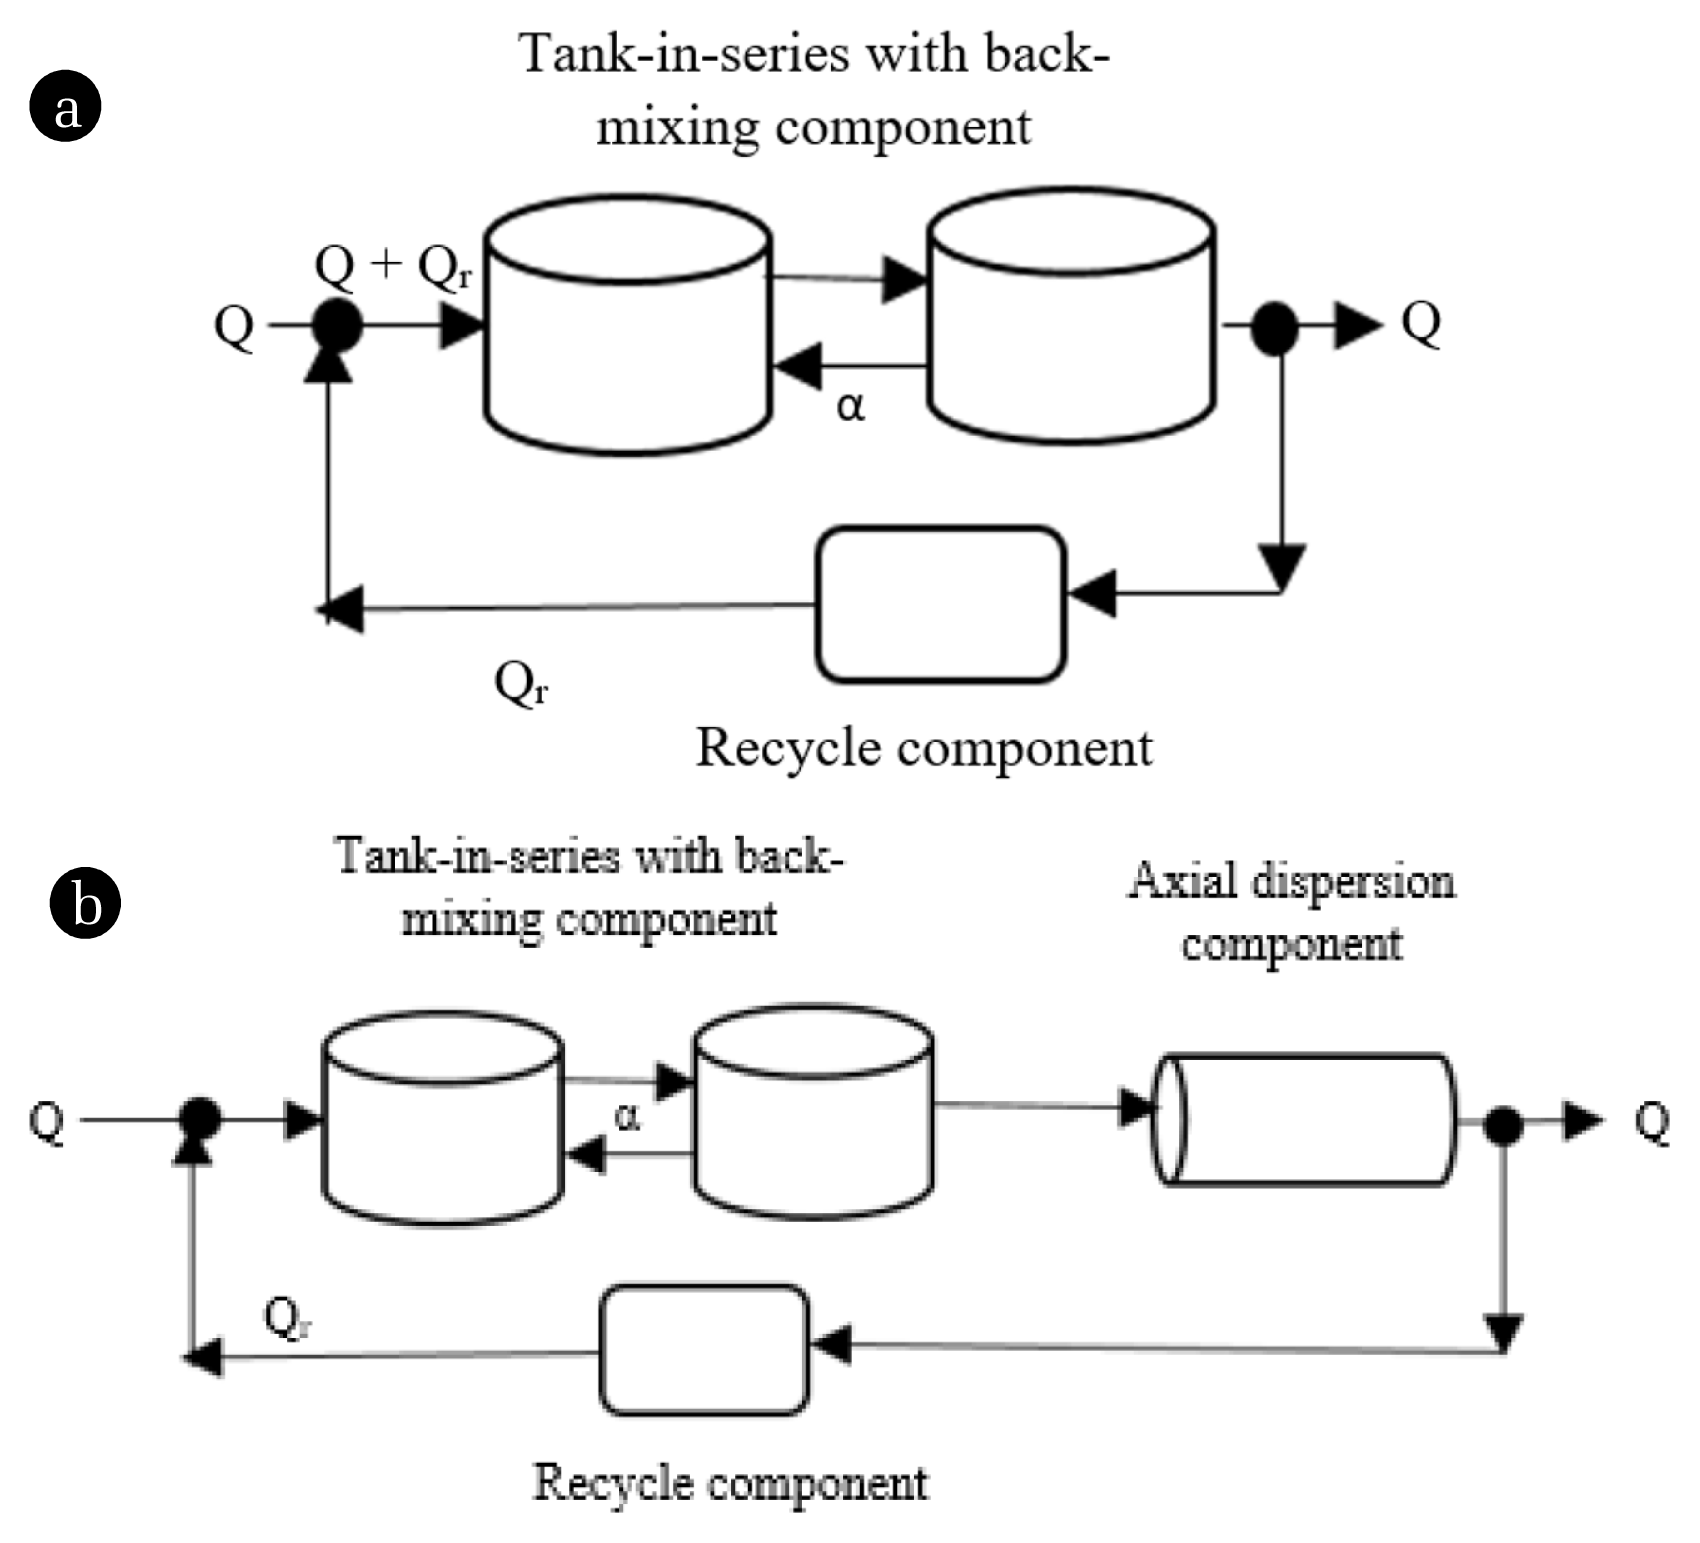
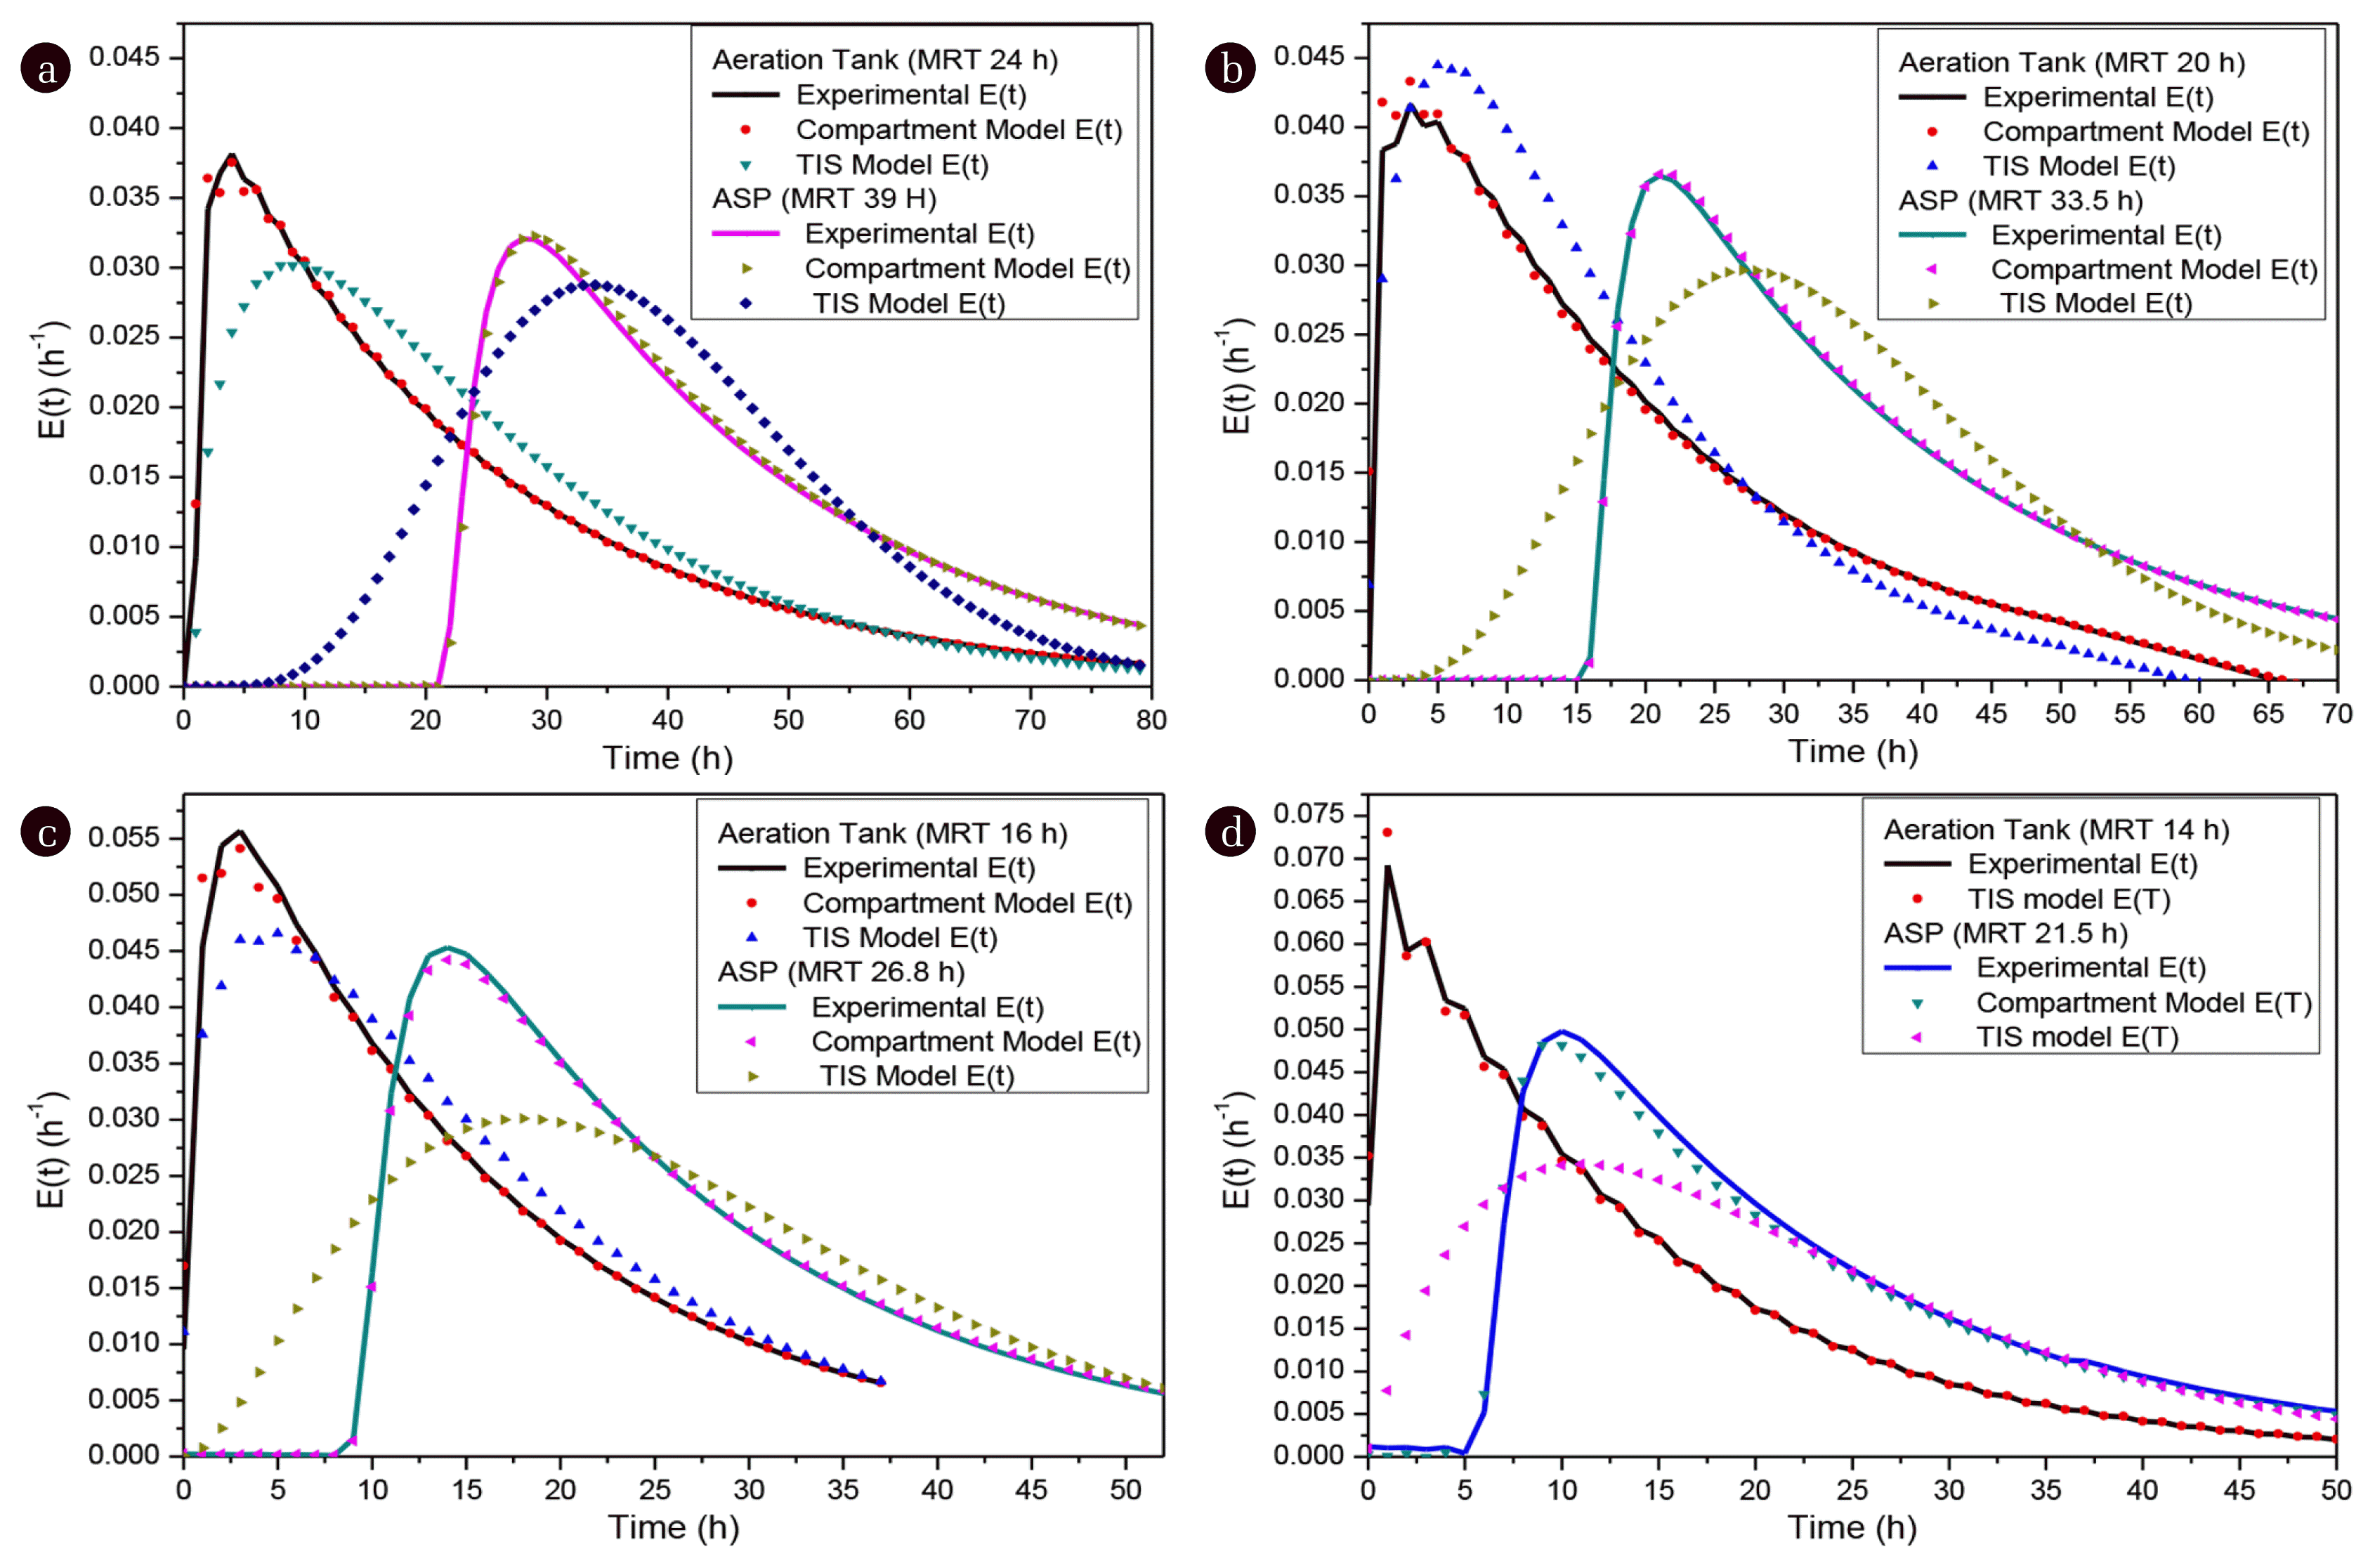
The hydraulic performance of pilot-scale AT and complete ASP was evaluated for steady-state performance. The DO concentration in the AT was maintained at 1.8–2.1 mg/L, considering difficulty to maintain DO level above 2 mg/L at the industrial operating condition. The set of different MRTs were chosen to establish a correlation. The RTD experiments were carried out on the AT at hydraulic MRT of 14, 16, 20 and 24 h. Once the background LiCl concentration is noted, it was injected at the inlet of the AT and monitored at the outlet of the AT (S1) and the overflow of secondary clarifier (S2). The analysis of the RTD curves for the AT (Fig. 3 (a)–(d)) indicates a distinguish peak at MRT 14 h, signifying the existence of bypassing streams in the AT at lower MRT. As the residence time of the effluent in the system is increased, that the flow inside the tank was more hydro-dynamically stable and the bypassing streams disappeared. The experimental RTD data also indicated the non-existence of parallel and recirculation steams in the AT. The fraction of stagnant zones present in the system was determined by comparing the designed and experimentally obtained MRT of the AT and ASP and has been summarized in Table 1 and Table 2, respectively. At lower MRT, the inflow effluent rate is high; hence negligible stagnant zones were present at the residence time of 14 h. To obtain a more extensive view of the behavior of the AT and ASP appropriate empirical models were proposed applying compartment modelling technique. In the prior RTD studies performed on the AT, it was observed that it behaved like a typical mixing tank with backflow or exchange [3, 40]. Conventional model as TIS and axial dispersion models were unable to satisfactorily portray the RTD curves [34, 40, 41]. Hence, the suggested compartment modelling was compared to conventional TIS model. The model proposed for AT (Fig. 2(a)) showed close concordance to continuous stirred tank reactor with back – mixing. The back-mixing ratio range obtained for the AT indicates that the diffused aeration system was providing sufficient aeration and the mixing intensity in the AT provided homogeneity to the AT maintaining the microorganisms well suspended in the tank. At the lower MRT, the AT behaved more as perfect mixing tank. However, increasing the MRT leads to increase in the back-mixing ratio drifting from perfect-mixing tank behavior. Back-mixing is needed for uniformity of composition within the vessel. The compartment model parameters for the AT, the number of tanks, N, and back-mixing ratio α, for each experiment were determined and have been listed in Table 1.
The hydrodynamics of complete ASP was more complex as it was a combination of the AT and secondary clarifier. The tracer concentrations were also measured at the overflow of the secondary clarifier (sampling point S2 in Fig. 1) for an overall MRT of 21.5, 26.6, 33.5 and 39 h. Based on the model fitting for AT a compartment model was suggested for complete ASP. The TIS model is a single parameter model that only accounts for the mixing intensity of the reactor in terms of the number of reactors, N. If the number of tanks, N equals to 1, the reactor behaves as a perfect mixing tank. As the value of N increases the reactor tends to behave as a plug flow reactor. As the ASP is a complex reactor, conventional TIS model fails to take into account the effect back-mixing, recycle streams and dead zones on the flow behavior of the AT [5, 20–21] the compartment model was able to better represent the entire ASP than the conventional TIS model. The building blocks for the model was a tank in series with back-mixing component coupled with axial dispersion model connected in series with recycling line with a plug flow component connected in parallel as shown in Fig. 2(b). The model parameters, the number of tanks, N, and back-mixing ratio α, and Peclet no (Pe) for each experiment were determined. The results of the RTD experimental data and model-simulated data for the AT and ASP have been shown in Fig. 3(a)–(d). The possibility of the dead-zones in the ASP was also calculated and has been reported in Table 2. The dead-zone fraction for all the set of experiments remained between the ranges of 0.5–2%, which was well below the experimental limits.
3.2. Effect of Recycle-Rate on the Hydraulic Performance of the AT and ASP
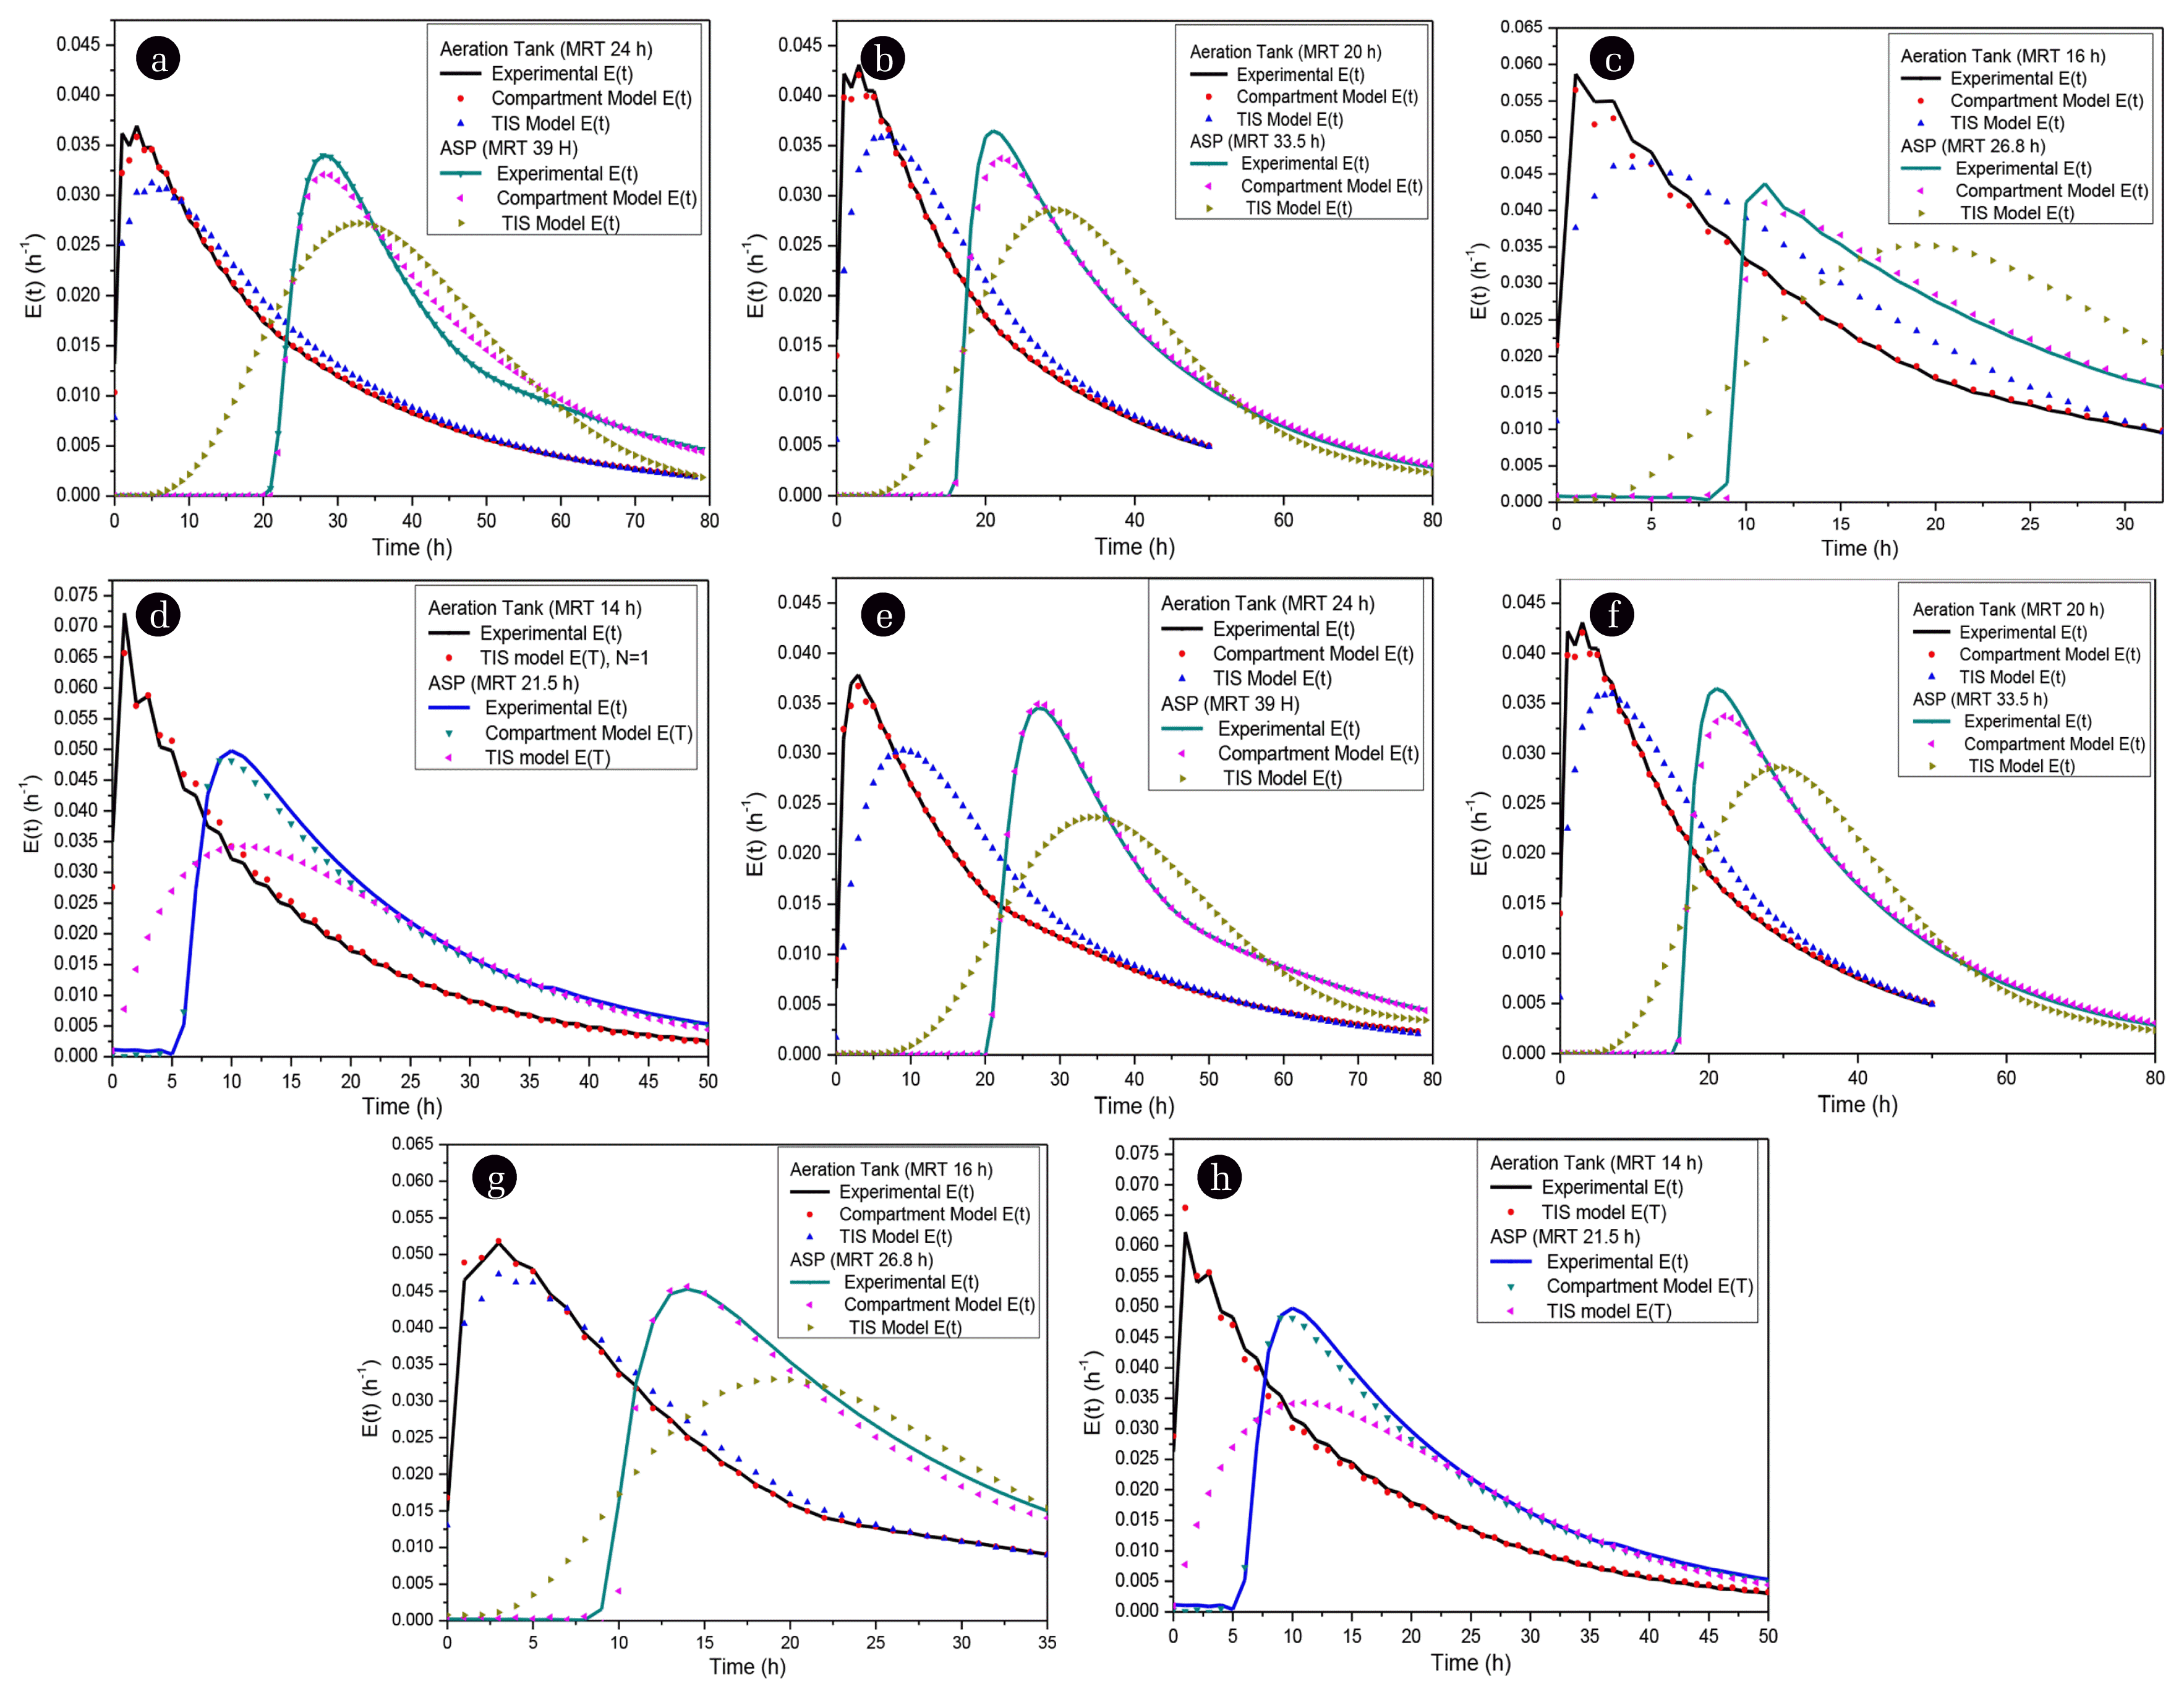
The biomass formed in the aeration and settled at the bottom of the clarifier is recycled back to the AT and its influence on the hydrodynamics of the AT and ASP was analyzed. For each set of MRT the sludge recycle ratio was set to 10% and 20% of the inflow rate and RTD experiment was performed. The RTD curves were studied and modelled with appropriate compartment models. The result of the RTD experimental data and model-simulated data has been presented in Fig. 4(a)–(d) and Fig. 4(e)–(h) for sludge recycle of 10% and 20%, respectively. The effect of recycling was found to be more prominent on the hydrodynamics of the AT than on the complete ASP and was more visible at higher residence time. The back-mixing ratio in the AT tends to increase with the increase in the sludge recycle ration. The recycle stream did not cause any bypassing parallel paths in the reactor. The compartment model proposed of the AT and ASP was similar to that proposed for the system without recycling; only a recycle line was added to the model that was able to compensate the effect of recycling on the system. The building blocks for the model was a tank in series with back-mixing component coupled along with axial dispersion model connected in series with recycling line with a plug flow component connected in parallel as shown in Fig. 2(b). The model parameters, number of tanks, N, and back-mixing ratio α, and Peclet number (Pe), Pe and recycle time, for each experiment was determined. The possibility of the dead- zones in the ASP intensified at high sludge recycle rate due to the high concentration of MLSS in the AT. The fraction of dead zone in the tank increases by approximate 20–25% with every 10% increase in recycle rate.
3.3. Effects of Varying Operational Parameters on Biological Treatment Efficiency
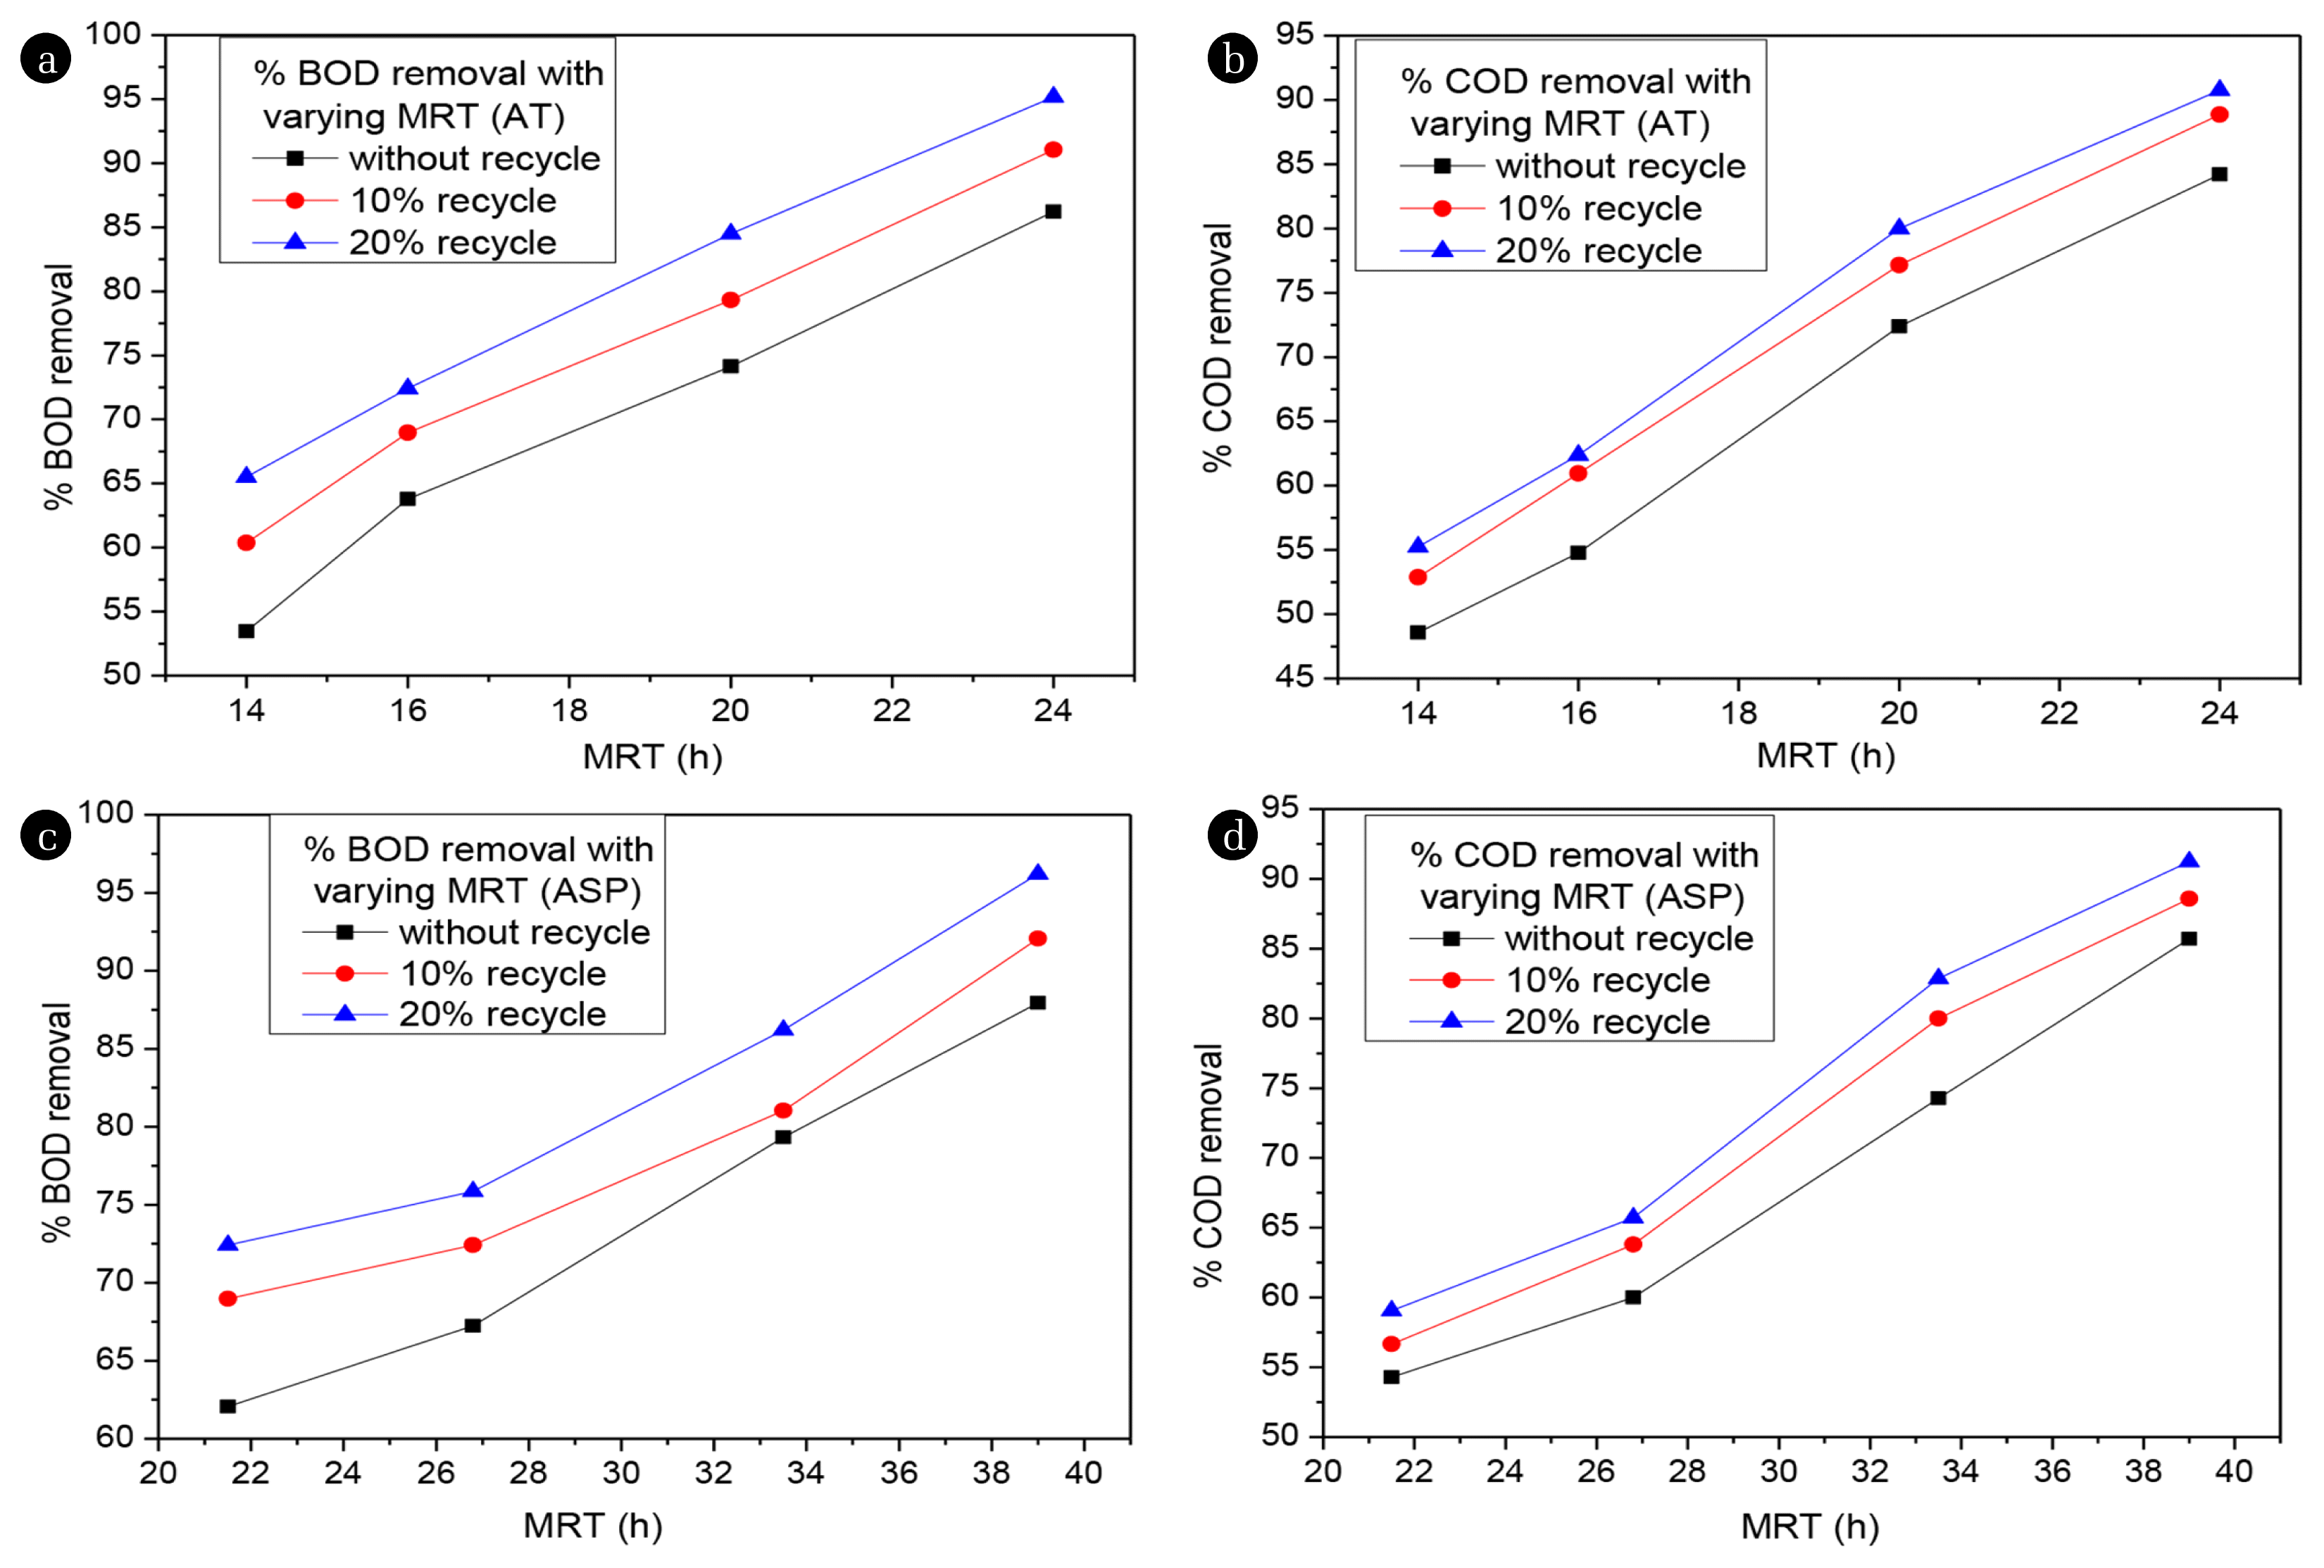
The comprehensive performance of ASP can only be obtained by taking into account the biological treatment efficiency along with the hydraulic performance. The hydrodynamics of the reactor directly influences the biological treatment efficiency of the tank [4, 9]. The intensity of mixing leads to enhanced mass exchange in the AT, hence directly influencing the concentration of residual polluting matter in the effluent. The knowledge of actual reactor MRT can prevent incomplete biochemical reactions in ASP and help in growth of desirable microorganisms [14, 23, 33]. With the optimal combination of operating parameters, optimized ASP performance can be achieved that result in minimum BOD and COD of the treated effluent [34]. The effect of effluent retention time (MRT) on the biological treatment efficiency of the AT was studied for MRT 14, 16, 20 and 24 h. The substrate removal efficiency of the organic load of the influent was measured in terms of BOD5 and COD. For each set of MRT the MLSS and DO concentration was maintained between 3,500–3,800 mg/L and 1.6–2 mg/L, respectively. The concentration of BOD and COD attained in the treated effluent at a different set of operating parameters has been listed in Table 3. The study revealed that the biological treatment efficiency of the effluent increased substantially with an increase in the residence time of the effluent. The percentage removal in COD and BOD were found to be 54%, 60%, 74%, 85% and 62%, 67%, 79%, 88% for MRT 14, 16, 20 and 24 h, respectively under steady state condition. The return sludge concentration was varied for each MRT and the effect on the treatment efficiency was observed. At a 10% and 20% sludge recycle from the clarifier, for the AT, the COD removal and BOD removal was found to be 56%, 63%, 80%, 88% and 68%, 72%, 81%, 92%, respectively for the MRT of 14, 16, 20 and 24 h. Similarly, the COD removal and BOD removal was found 59%, 65%, 82%, 91% and 71%, 75%, 86%, 96%, respectively for complete ASP working at MRT 21.5, 26.8, 33.5 and 39 h. The effect of varying MRT and recycle rate on the treatment efficiency of the AT and ASP is shown in Fig. 5(a)–(b) and Fig. 5(c)–(d), respectively. Increasing the MRT of the AT and complete ASP did not indicate appearance of any significant dead zone or bypassing streams in the tank. The mixing intensity at higher MRT was found to enhance due to significant back-mixing in the reactors. Hence, the percentage removal of BOD and COD increases as MRT of the AT and hence the ASP increases (Fig. 5 (a)–(b) and Fig. 5 (c)–(d)). It was observed that for a given increasing the recycle flow in the AT increase the MLSS load in the AT and the treatment efficiency of the influent was also increased. This increase in substrate removal can be justified as no bypassing and parallel streams were observed as the recycle ration of return sludge line was increased. BOD removal increased from 87% to 96% by increasing the recycling rate by 20%. The substrate removal was most suitable at MRTs higher than 24 h at 20% for the AT process treating paper mill effluent as at this condition the system was able to meet the discharge standards. The BOD removal efficiency of the complete ASP was found to increase from 62% to 88% with the increase in residence time from 21.5 h to 39 h. It was also observed that the biological performance of the complete ASP improved with the increase of recycling rate and the maximum BOD and COD removal efficiency of 96% and 91% was achieved at the MRT of AT at 24 h with 20% of sludge recycle, corresponding to COD and BOD of inlet effluent 1,050 mg/L and 580 mg/L.
4. Conclusions
RTD study was performed on a pilot scale ASP. The effect of MRT and recycle rate on the hydrodynamic as well as the biological performance of the AT and entire ASP was observed. The study found at lower MRT the problem of bypassing was quite prominent whereas back-mixing and dead zone were more pronounced at higher MRT. Increasing the recycling rate intensified the back-mixing ratio in the AT. It was also observed that at higher MRT the clarifier tends to act an ideal plug flow reactor hence improving the settling ability of the biomass in the clarifier. The compartment modelling approach adapted to represent the hydrodynamics of the AT and complete ASP was vastly appropriate than the often used conventional TIS model. The biological performance of the AT and complete ASP were also simultaneously evaluated in terms of percentage BOD and COD removal efficiency. The treatment efficiency was found to increase substantially with the increase of MRT and recycle rate. The effect of MRT was more evident on the substrate removal efficiency. The BOD and COD removal efficiencies were maximum for ASP operating at MRT of 39 h with 20% sludge recycle. The results from the RTD experiment can be used for the hydraulic modelling of a complex bioreactor; the selection of a proper model to describe the reactor behavior should be based on a combination of discrete reactors in an organized manner. The present study has immense implication in industrial wastewater treatment. The industrial activated sludge reactor often run on a set of parameters, that is hard to alter due to process limitations. The present study provides the performance of AT and ASP over a range of operating parameters that can be helpful in deliver information for choosing an optimum working condition in ASP design.


