1. Introduction
Modern fuel cells, which are widely used in portable electronic devices and for mobile energy generation, are significantly more efficient than the current internal combustion engines and are environmentally friendly, producing no COx, NOx, hydrocarbons, or soot [1]. The water gas shift (WGS) reaction plays an important role in such technologies. This reaction is reversible and exothermic, as shown below [2]:
At the industrial level, the WGS reaction is performed in two steps to overcome thermodynamic limitations. The first step is a high temperature shift (HTS, 350°C – 450°C) reaction, typically performed over Fe2O3/Cr2O3 catalysts, and the second is a low temperature shift (LTS, 180°C – 250°C) reaction, typically performed over Cu/Zn/Al2O3 catalysts [3]. The HTS reaction is more critical compared with the LTS reaction for compact fuel processors that feature integrated on-board hydrogen production because the first-step reactor typically occupies ca. 70% of the total volume of such systems. Consequently, a robust single-stage WGS reactor is desirable for compact fuel cell systems [4]. However, commercial WGS catalysts are not suitable for compact reformers owing to restrictions in volume, weight, and cost [5]. Furthermore, commercial WGS catalysts are pyrophoric and require complex preconditioning steps [5]. As a result, precious-metal-based catalysts have been explored in an attempt to overcome these limitations.
Precious metals, such as Pt, Pd, and Au, supported on reducible oxides (CeO2, TiO2, and Fe2O3) have been reported as promising next-generation catalysts that exhibit excellent performance in the WGS reaction at low temperatures [6–9]. However, the high cost and scarcity of these metals inhibit their utility for industrial-scale applications. Thus, the design and synthesis of cost-effective precious-metal-free catalysts for single-stage WGS reaction in compact reformers are highly desirable.
In our previous study, we investigated the Ce/Zr ratio in Cu-CeO2-ZrO2 catalysts employed in the LTS step [10]. A cubic-phase Cu-Ce0.8Zr0.2O2 catalyst exhibited the highest turnover frequency and lowest activation energy of the catalysts tested, and its CO conversion was maintained for 100 h. The excellent performance of this catalyst was attributed to the presence of abundant oxygen vacancies and the strong interaction between CuO and cubic-phase Ce0.8Zr0.2O2.
Although the CeO2-ZrO2 support with high oxygen vacancy was found to play an important role in enhancing activity, but the behavior of Cu active species is not completely understood. Typically, the amount of Cu active species can be controlled by varying the loading amount of Cu. However, the characteristics of Cu species appear to be strongly influenced by the Cu sintering [11]. Therefore, a further investigation into the effect of Cu loading on the physicochemical property and catalytic performance of Cu-Ce0.8Zr0.2O2 catalysts is necessary. In particular, the correlation of the characteristic of Cu species with turnover frequency & CO conversion is elucidated.
Consequently, in the present study, we focused on optimizing the Cu loading in a cubic Ce0.8Zr0.2O2-supported Cu catalyst to further improve its performance. For this approach, we synthesized a series of catalysts with different Cu loadings in the range of 20 wt% – 90 wt% and evaluated their LTS-reaction performances in the temperature range of 240°C – 320°C. Furthermore, the catalysts were characterized by Brunauer-Emmett-Teller (BET) surface area analysis, X-ray diffraction (XRD), N2O-chemisorption, and temperature-programmed reduction (TPR), and the results of these analyses were discussed in terms of the WGS reaction activity.
2. Experimental
2.1. Catalyst Preparation
Cu-Ce0.8Zr0.2O2 catalysts with various Cu loading amounts (20, 40, 60, 80, and 90 wt%) were synthesized using a one-step co-precipitation method. First, appropriate stoichiometric quantities of Cu(NO3)3·xH2O (99%, Aldrich), Ce(NO3)3·6H2O (99%, Aldrich) and zirconyl nitrate solution (20 wt% ZrO2 basis, MEL Chemicals) were dissolved in distilled water. Then, 15 wt% KOH solution was added dropwise at 80°C with constant stirring to attain pH 10.5. The resultant precipitate was aged at 80°C for 3 d. The obtained materials were washed, collected, and air-dried for 24 h and then dried at 110°C for 6 h. The dried materials were crushed into powder and annealed in a furnace at 400°C for 6 h. These final products were used in the WGS reaction.
2.2. Characterization
The BET surface areas of the catalysts were measured using a nitrogen physisorption technique on an ASAP 2010 (Micromeritics) accelerated surface area and porosimetry instrument. Before analysis, the samples were degassed for 12 h at 110°C under a pressure of less than 0.5 mm Hg. XRD was performed using a Rigaku D/MAX-IIIC diffractometer operated at 40 kV and 100 mA with Ni-filtered CuKα radiation. The crystallite size was calculated from the diffraction pattern using the Scherrer equation.
where D is the crystallite size, K is the shape factor (0.89 for a sphere), λ is the wavelength of Cu Ka (1.54 Å), β is the full width half maximum (FWHM), and θ is the Bragg diffraction angle. TPR experiments were performed using an Autochem 2910 (Micromeritics) instrument. The TPR experiments were conducted as described in previous papers [12, 13]. The N2O-chemisorption experiments were performed using an Autochem 2920 (Micromeritics) instrument. Before N2O-chemisorption, the fresh samples were reduced at 250°C for 2 h in 10 vol% H2/Ar. The consumption of N2O and release of N2 by the metallic Cu sites at 60°C (N2O + 2Cu → Cu2O + N2) were monitored using a thermal conductivity detector.
2.3. Catalytic Reaction
Activity tests were conducted by the same quartz reactor used in our previous study [10]. Before starting the reaction, the catalyst was reduced at 400°C for 1 h under a stream of 5% H2/N2. The catalyst was then evaluated at different reaction temperatures covering the range of 200°C – 400°C. A gas hourly space velocity (GHSV) of 72,152 h−1 was employed to screen the catalysts in this study. A mass flow controller (Brooks Instrument 5850E) was used to feed the gaseous mixture (6.5 vol% CO, 7.1 vol% CO2, 0.7 vol% CH4, 42.4 vol% H2, 28.7 vol% H2O, and 14.5 vol% N2), and a syringe pump was installed to supply water. A heating coil for vaporizing water was wrapped around the gas feed line close to the quartz reactor. The product gas from the reactor was monitored by an online micro-gas chromatographer (Agilent 3000) equipped with a molecular sieve and PLOT U columns.
The turnover frequency (TOF) was measured in separate experiments wherein the conversion of CO was kept below 20% so that the differential reaction conditions could be assumed with negligible heat and mass-transfer effects. TOF was calculated using the equation:
where COin and COout are the inlet and outlet concentrations of CO, respectively, ABM is the atomic weight of metal M, F is the total flow rate (mol s−1), D is the metal dispersion, W is the mass of catalyst (g), and XM is the metal content (gmetal gcat−1).
The Arrhenius plot can be obtained from the relationship between TOF and temperature.
where A is the pre-exponential factor, T is the reaction temperature (K), R is the ideal gas constant (J/mol·K), and Ea is the activation energy (kJ/mol).
3. Results and Discussion
3.1. Catalyst Characterization
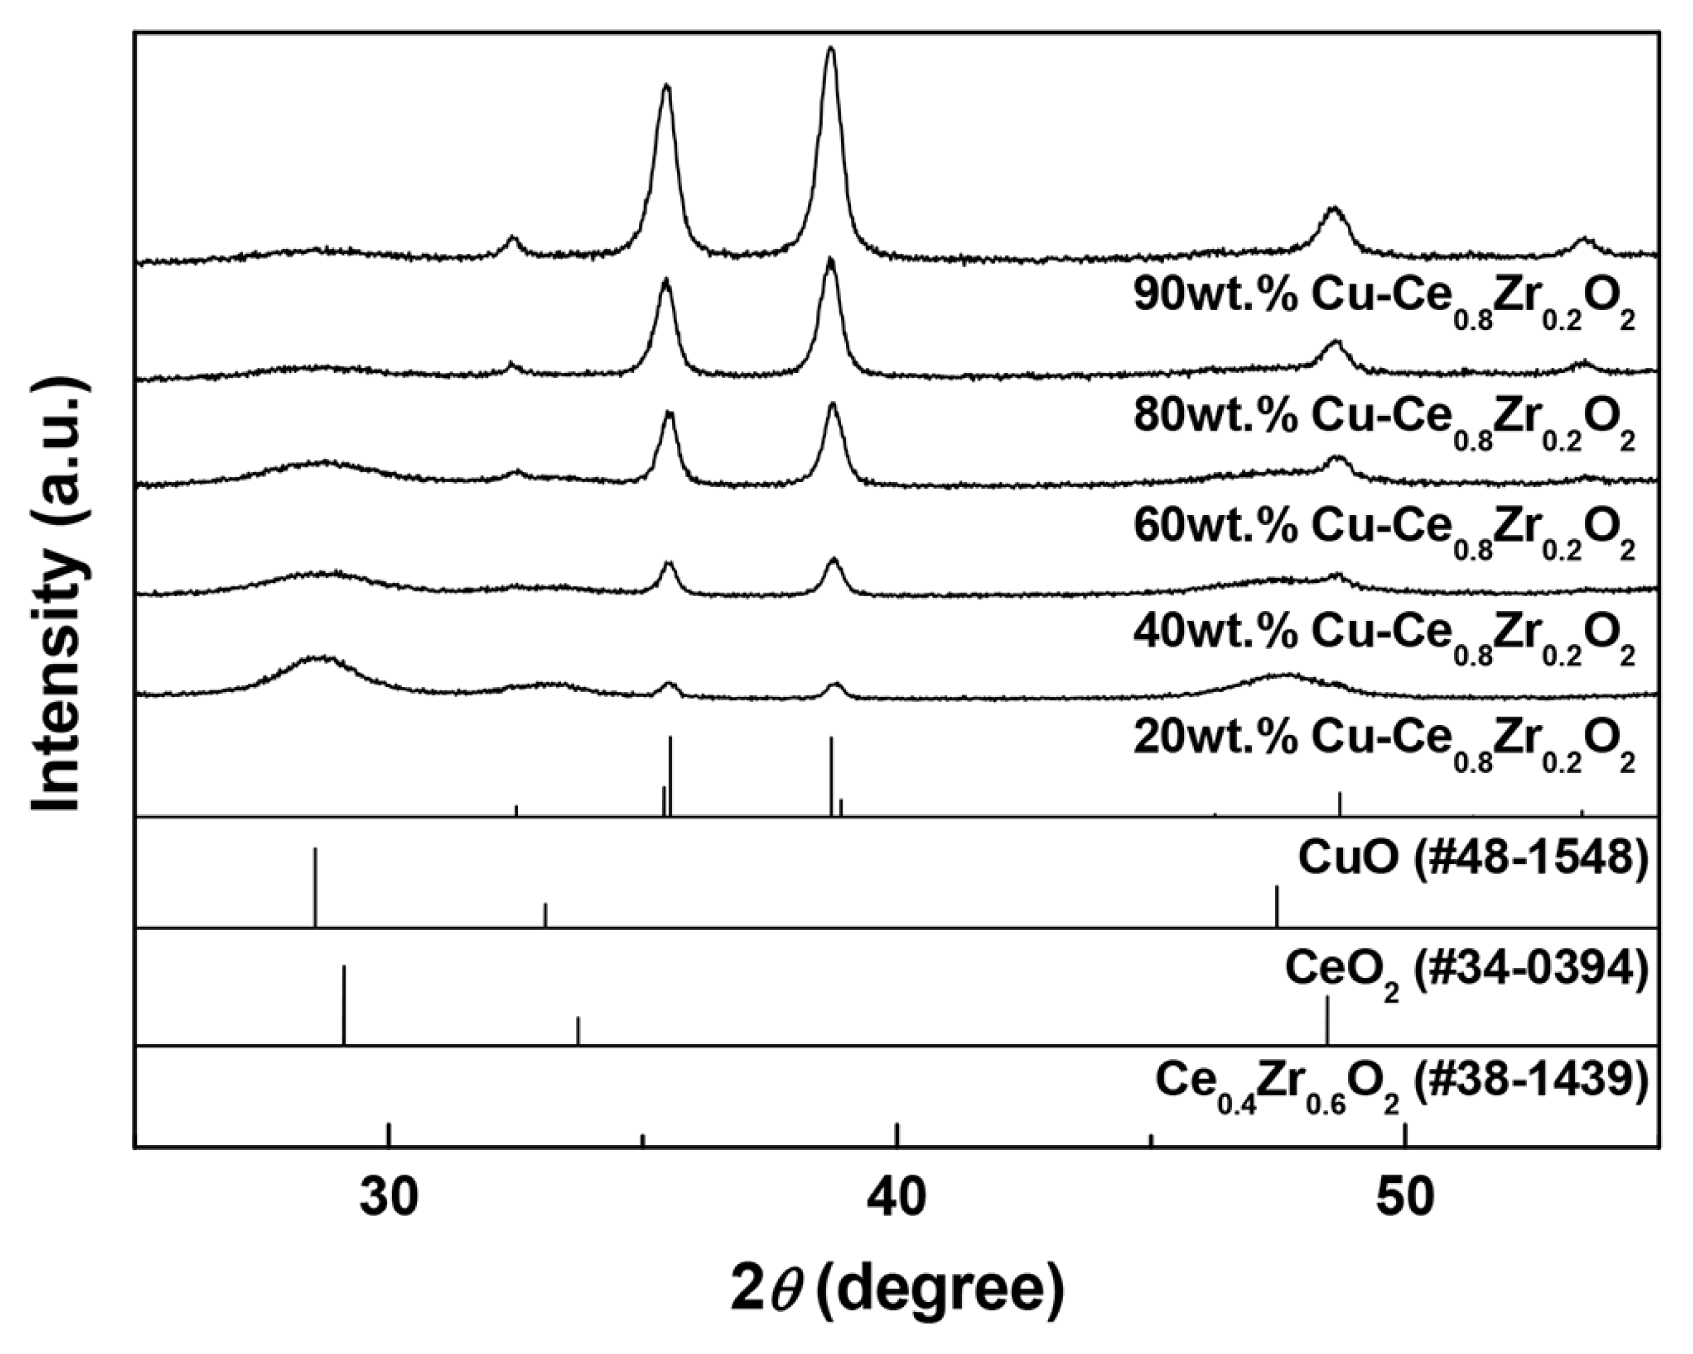
The XRD patterns of the Cu-Ce0.8Zr0.2O2 catalysts with increasing Cu loading (20 wt% to 90 wt%) are shown in Fig. 1. All the catalysts exhibit characteristic peaks of CuO at 35.4° and 38.7°. The intensity of the ceria diffraction peak at 2θ = 28.4° gradually decreases with increasing Cu content, indicating a decreasing degree of crystallinity. The average CuO crystallite sizes in the x wt% Cu-Ce0.8Zr0.2O2 catalysts were calculated according to the Scherrer equation and are listed in Table 1. The average CuO crystallite size decreases with decreasing Cu loading. The results indicate that Cu is dispersed on the surface of cubic Ce0.8Zr0.2O2 upon forming small crystals of CuO. Similar results have been reported by Li et al. [14].
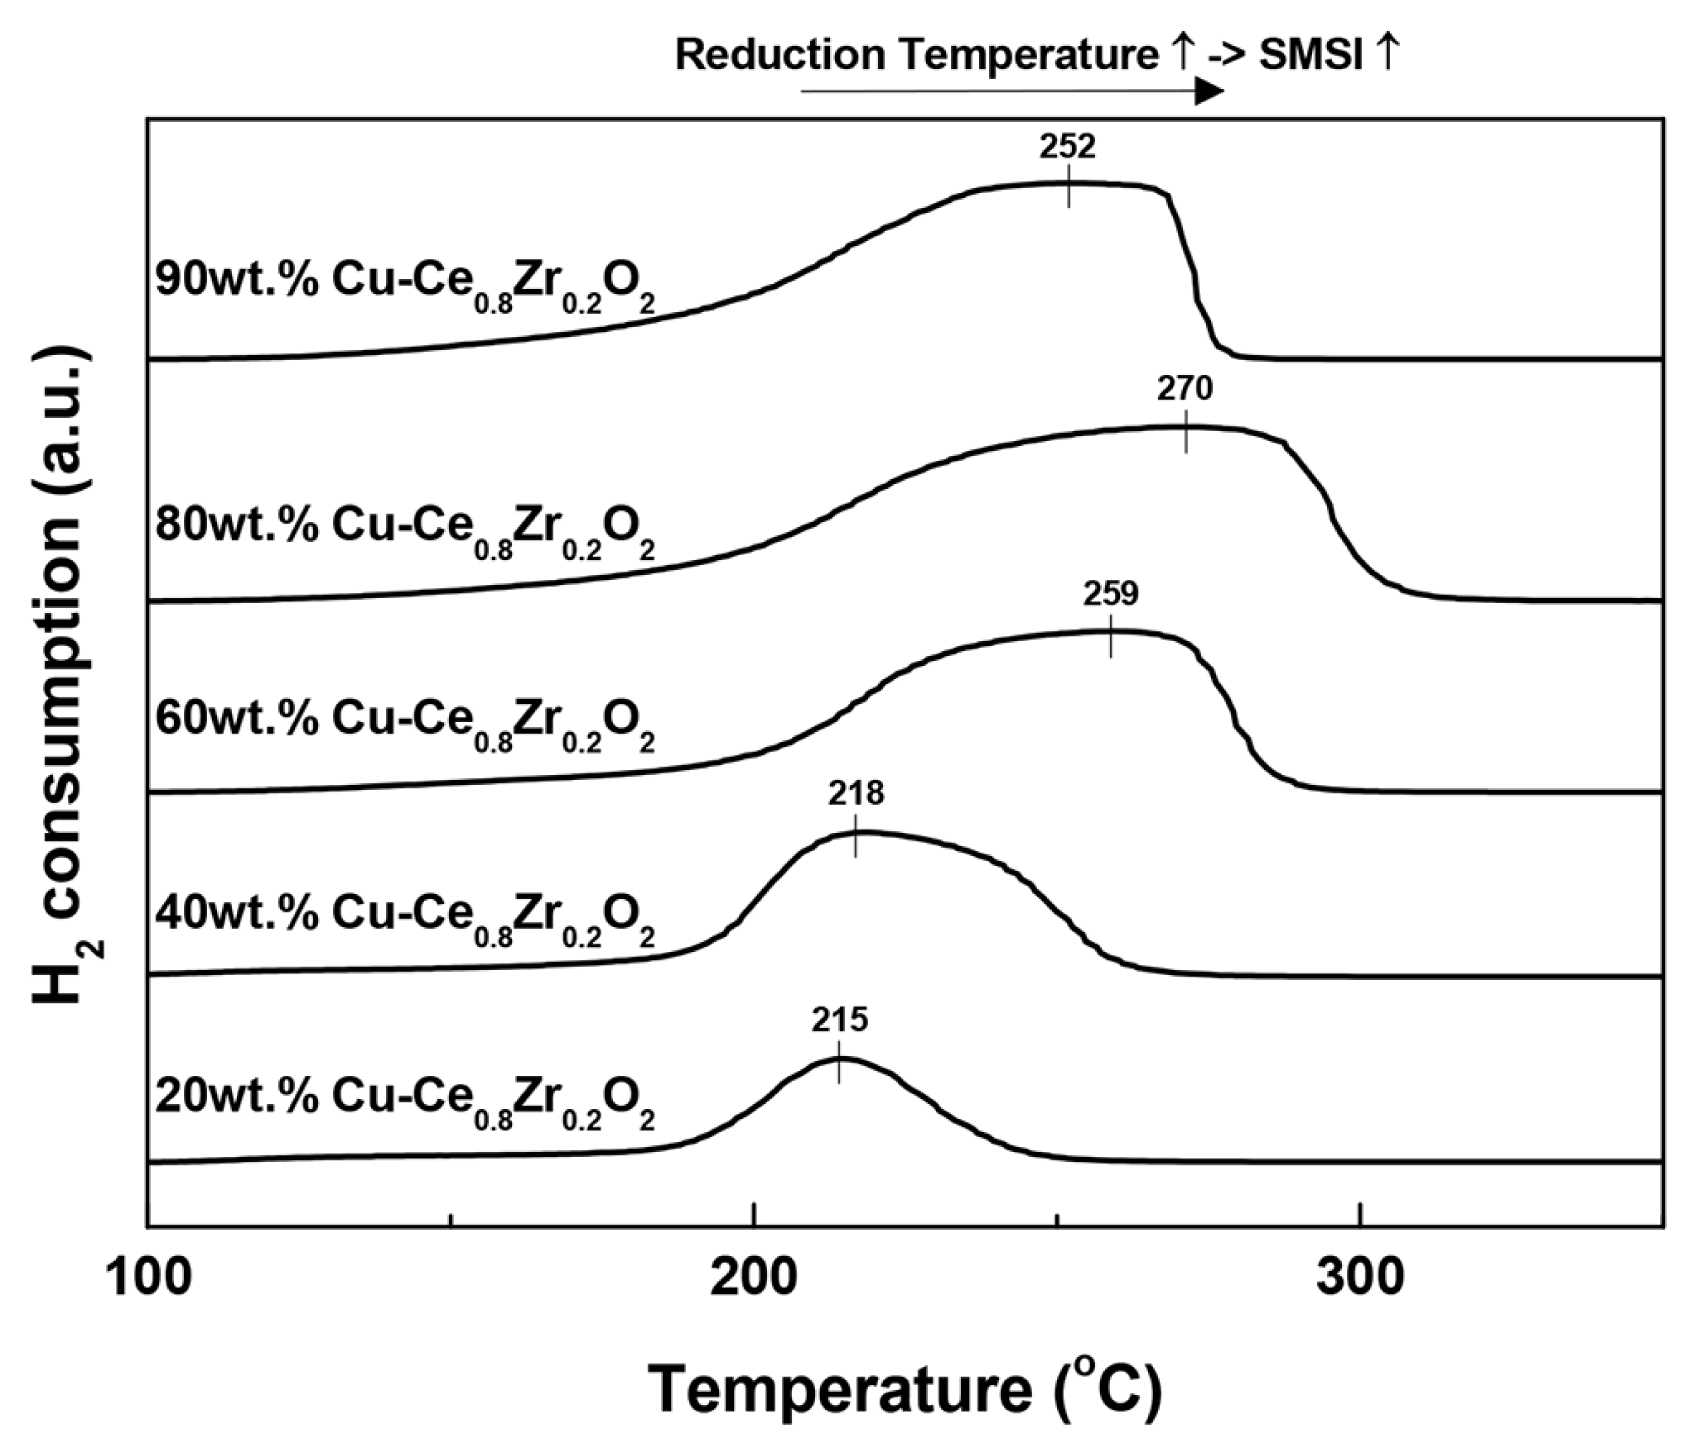
The TPR profiles of the catalysts are presented in Fig. 2. All the catalysts exhibit a broad reduction peak attributed to the combined reduction of highly dispersed CuO (at lower temperature) and CuO associated to ceria (at higher temperature). The higher temperature shoulder peak shifts to a higher value and simultaneously becomes broader with increasing Cu loading up to 80 wt%. However, it shifts back to a lower temperature in the case of the 90 wt% Cu-Ce0.8Zr0.2O2 catalyst. The shift of the shoulder peak toward higher temperature indicates an increasing interaction between CuO and cubic Ce0.8Zr0.2O2 support, which diminishes beyond 80 wt% Cu loading. This may be due to the separation of CuO from the catalyst at Cu loadings beyond 80 wt%. A strong interaction between CuO and catalyst material has been reported to result in stable catalytic performance [5].
The BET surface areas of the catalysts are presented in Table 1. The BET surface areas decrease with increasing Cu loading. The Cu dispersions in the catalysts were measured using N2O-chemisorption, revealing that the dispersion of Cu decreases with increasing Cu loading. The values for Cu dispersion range from 3.6% to 7.8%, with the 20 wt% Cu-Ce0.8Zr0.2O2 catalyst exhibiting the highest value (7.8%). This indicates that the 20 wt% Cu-Ce0.8Zr0.2O2 catalyst possesses the smallest Cu particle size among the prepared catalysts.
3.2. Reaction Results
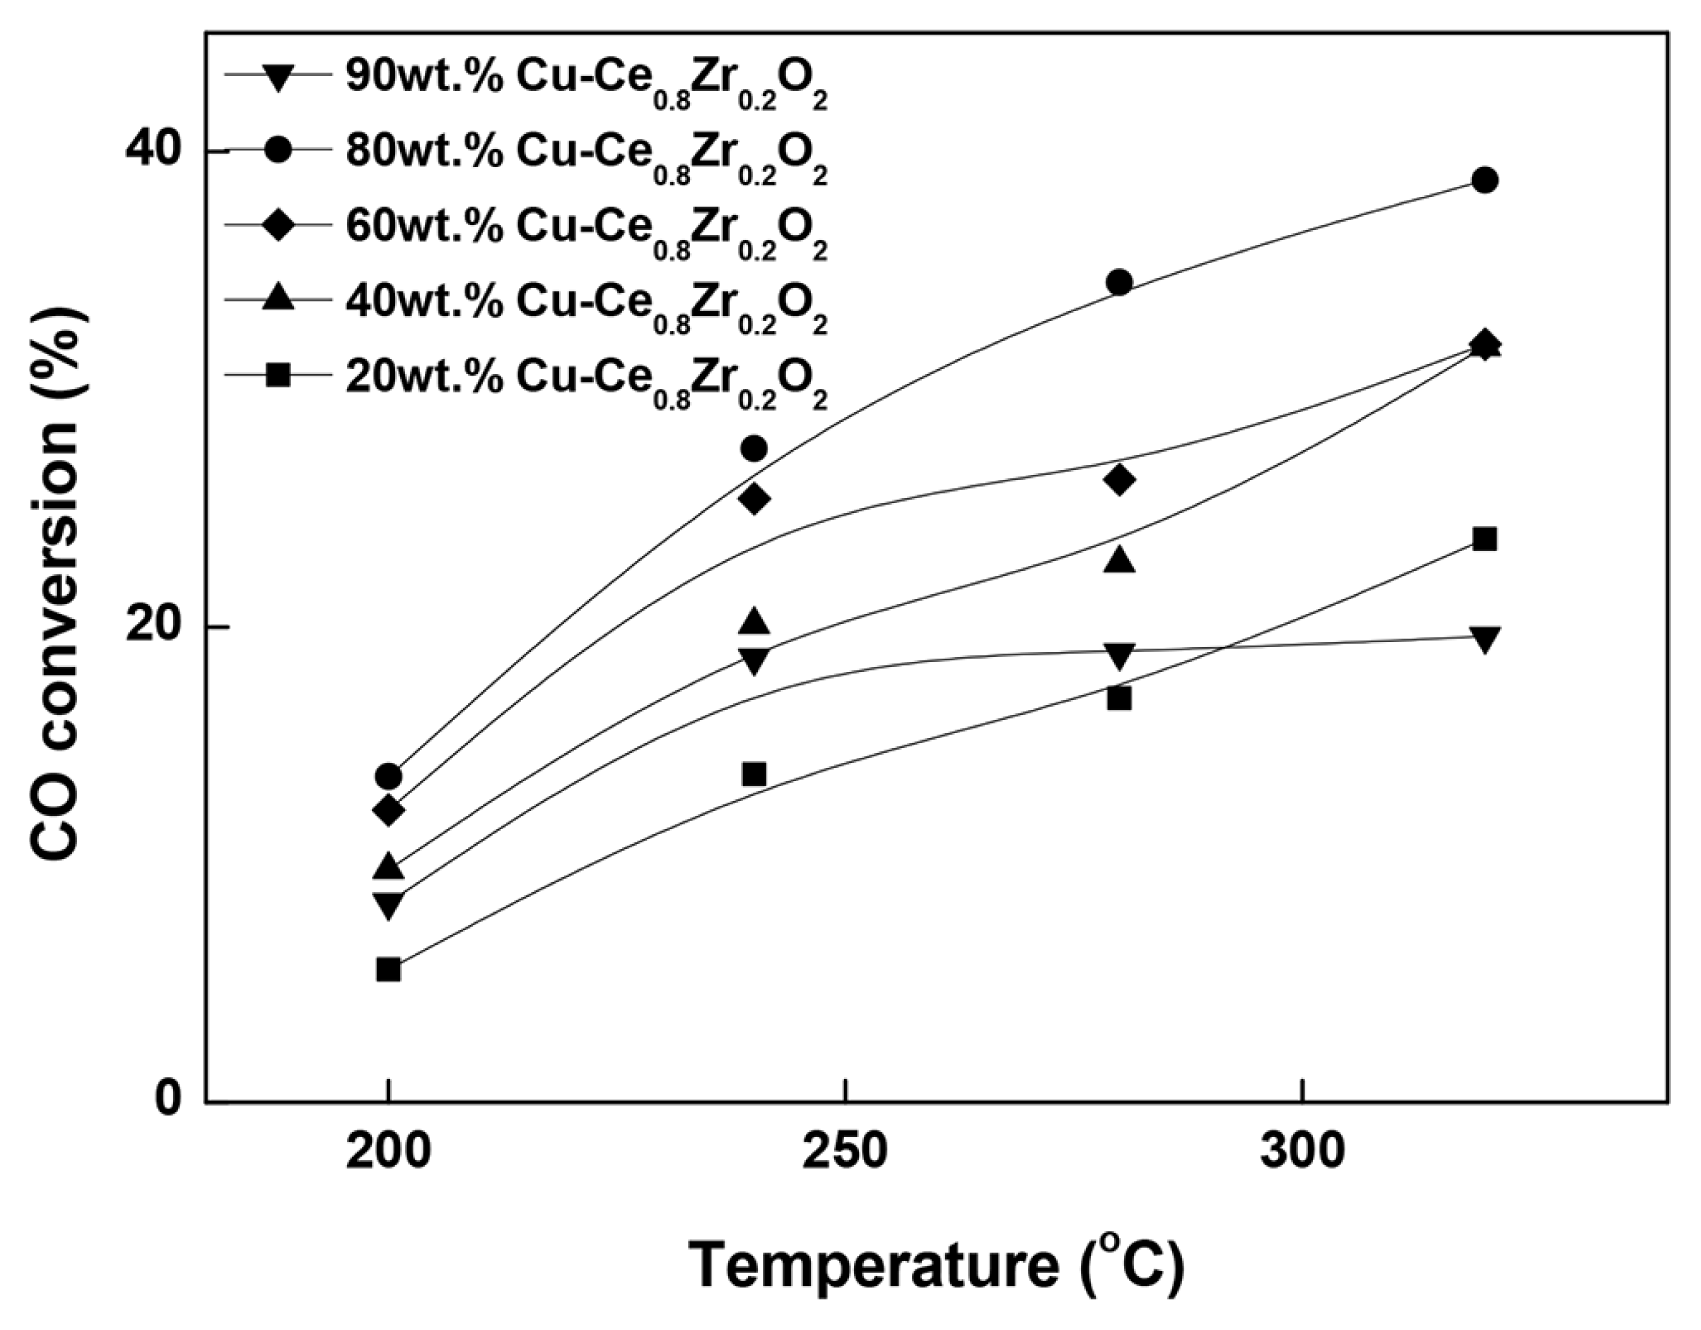
Fig. 3 shows the WGS activities of the catalysts as a function of reaction temperature in the range of 240°C – 320°C. The results clearly show that Cu loading has a strong influence on the WGS activity. The catalytic activity increases with increasing Cu loading from 20% to 80%. Further increase in Cu loading does not improve catalytic activity. The 80 wt% Cu-Ce0.8Zr0.2O2 catalyst exhibits the highest activity among the tested catalysts over the examined temperature range. However, the 90 wt% Cu-Ce0.8Zr0.2O2 catalyst exhibits inferior activity than those of the 40 wt%, 60 wt%, and 80 wt% Cu-Ce0.8Zr0.2O2 catalysts but superior activity compared with the 20 wt% Cu-Ce0.8Zr0.2O2 catalyst. Thus, a Cu loading of 80 wt% is optimal for the LTS reaction. The activity results indicate that the catalytic performance in this study does not depend on either surface area or metal dispersion. However, it depends on the extent of interaction between CuO and the support. Thus, the excellent activity of the 80 wt% Cu-Ce0.8Zr0.2O2 catalyst is primarily because of the strong interaction between the supported CuO and the Ce0.8Zr0.2O2 oxide.
TOF, surface Cu atoms, and activation energy results are summarized in Table 2. The number of surface Cu atoms was calculated from the Cu dispersion and Cu loading data. The number of surface Cu atoms increases with increasing Cu loading from 20% to 80%. However, further increase in Cu loading beyond 80 wt% decreases the number of surface Cu atoms, typically due to sintering by excess Cu. This result is consistent with the CO conversion and TPR results. We can conclude that the number of surface Cu atoms on the catalyst support strongly affects the catalytic performance. Thus, the high catalytic activity of the 80 wt% Cu-Ce0.8Zr0.2O2 catalyst is primarily attributed to the interaction between CuO and Ce0.8Zr0.2O2, which results from the abundant surface Cu atoms. The TOF results were calculated from separate kinetic measurements that were ob tained under differential GHSV (150,494 h−1), considering the results of the N2O-chemisorption experiments. 20 wt% Cu-Ce0.8Zr0.2O2 catalyst shows the highest TOF among the tested catalysts because of the highest Cu dispersion. In fact, the trend of TOFs is similar to that of Cu dispersion.
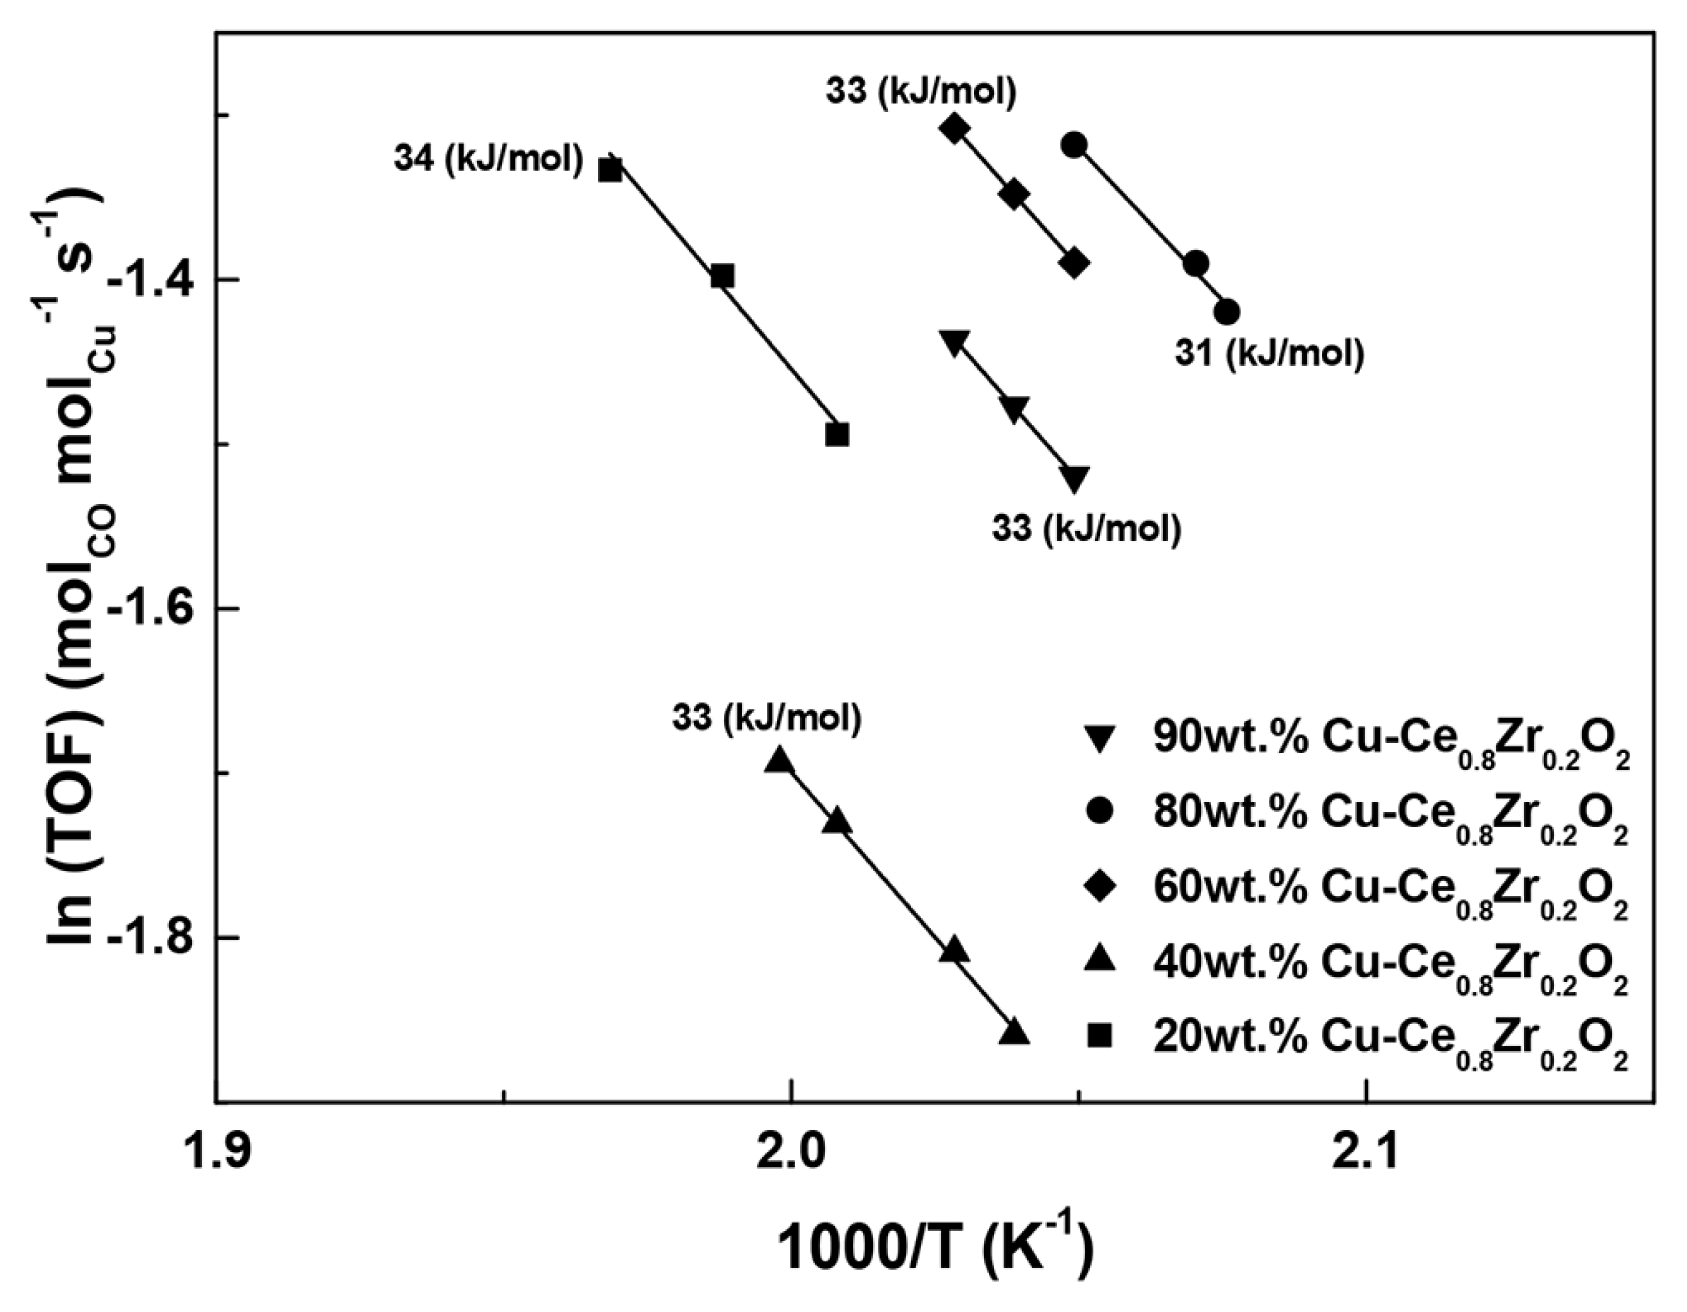
The TOF results are summarized in the Arrhenius-type diagram in Fig. 4, where the TOFs obtained from the examined catalysts are plotted as a function of the reaction temperature. The activation energies (Ea) of the WGS reactions over the Cu-Ce0.8Zr0.2O2 catalysts were calculated from the slopes of the fitted lines in Fig. 4 and are summarized in Table 2. The activation energies range from 31 ± 1 to 34 ± 2 kJ mol−1, with the 80 wt% Cu-Ce0.8Zr0.2O2 catalyst exhibiting the lowest activation energy of 31 ± 1 kJ mol−1. Notably, the highest CO conversion over the Cu-Ce0.8Zr0.2O2 catalysts corresponds to the lowest activation energy. Thus, we can reason that the role of Cu is to lower the barrier for oxygen transfer from the support to the metal, thereby facilitating the oxidation of adsorbed CO.
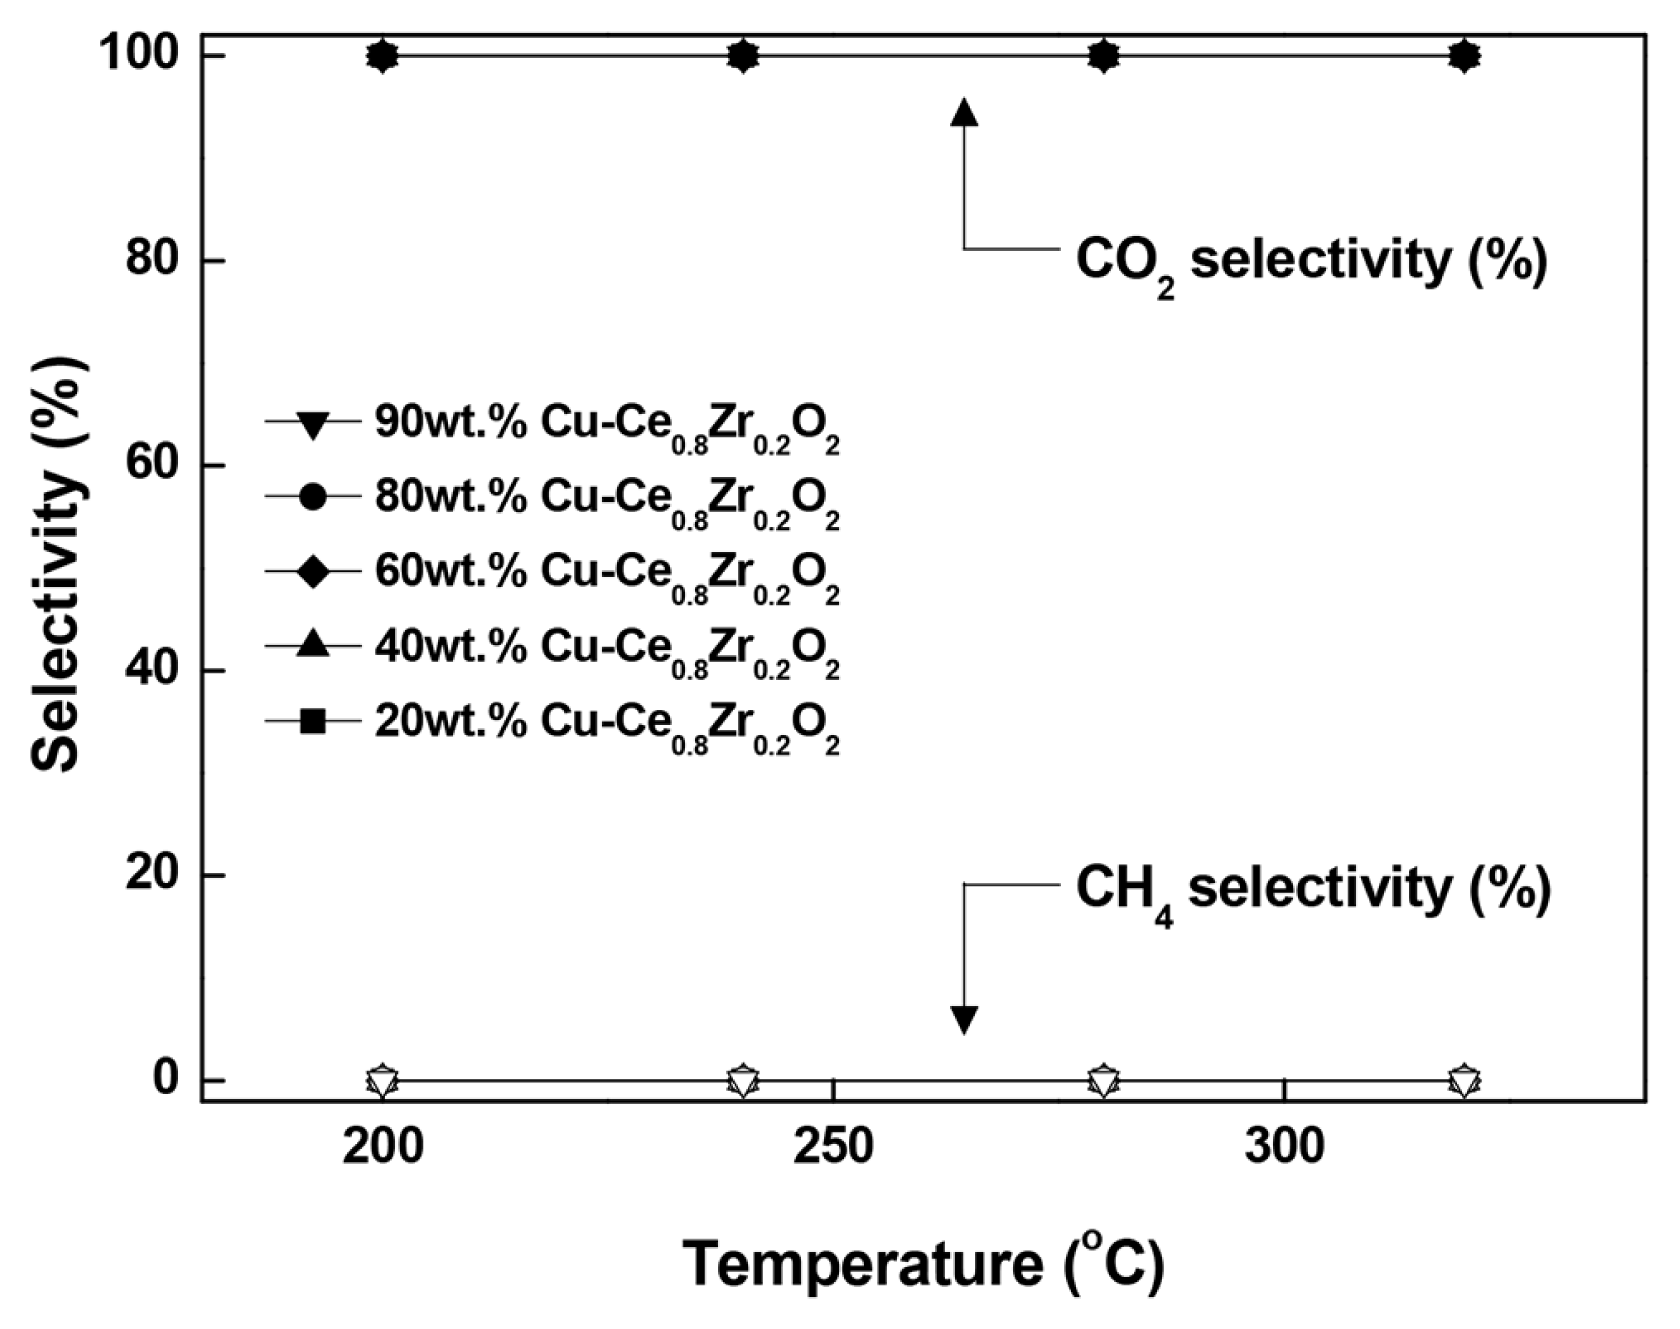
Fig. 5 shows the product selectivity for CO2 and CH4 of the reactions over Cu-Ce0.8Zr0.2O2 catalysts with different Cu loadings. Almost 100% CO2 selectivity is achieved with all the prepared catalysts, indicating that the amount of Cu on the cubic Ce0.8Zr0.2O2 catalyst does not influence product selectivity for the LTS reaction.
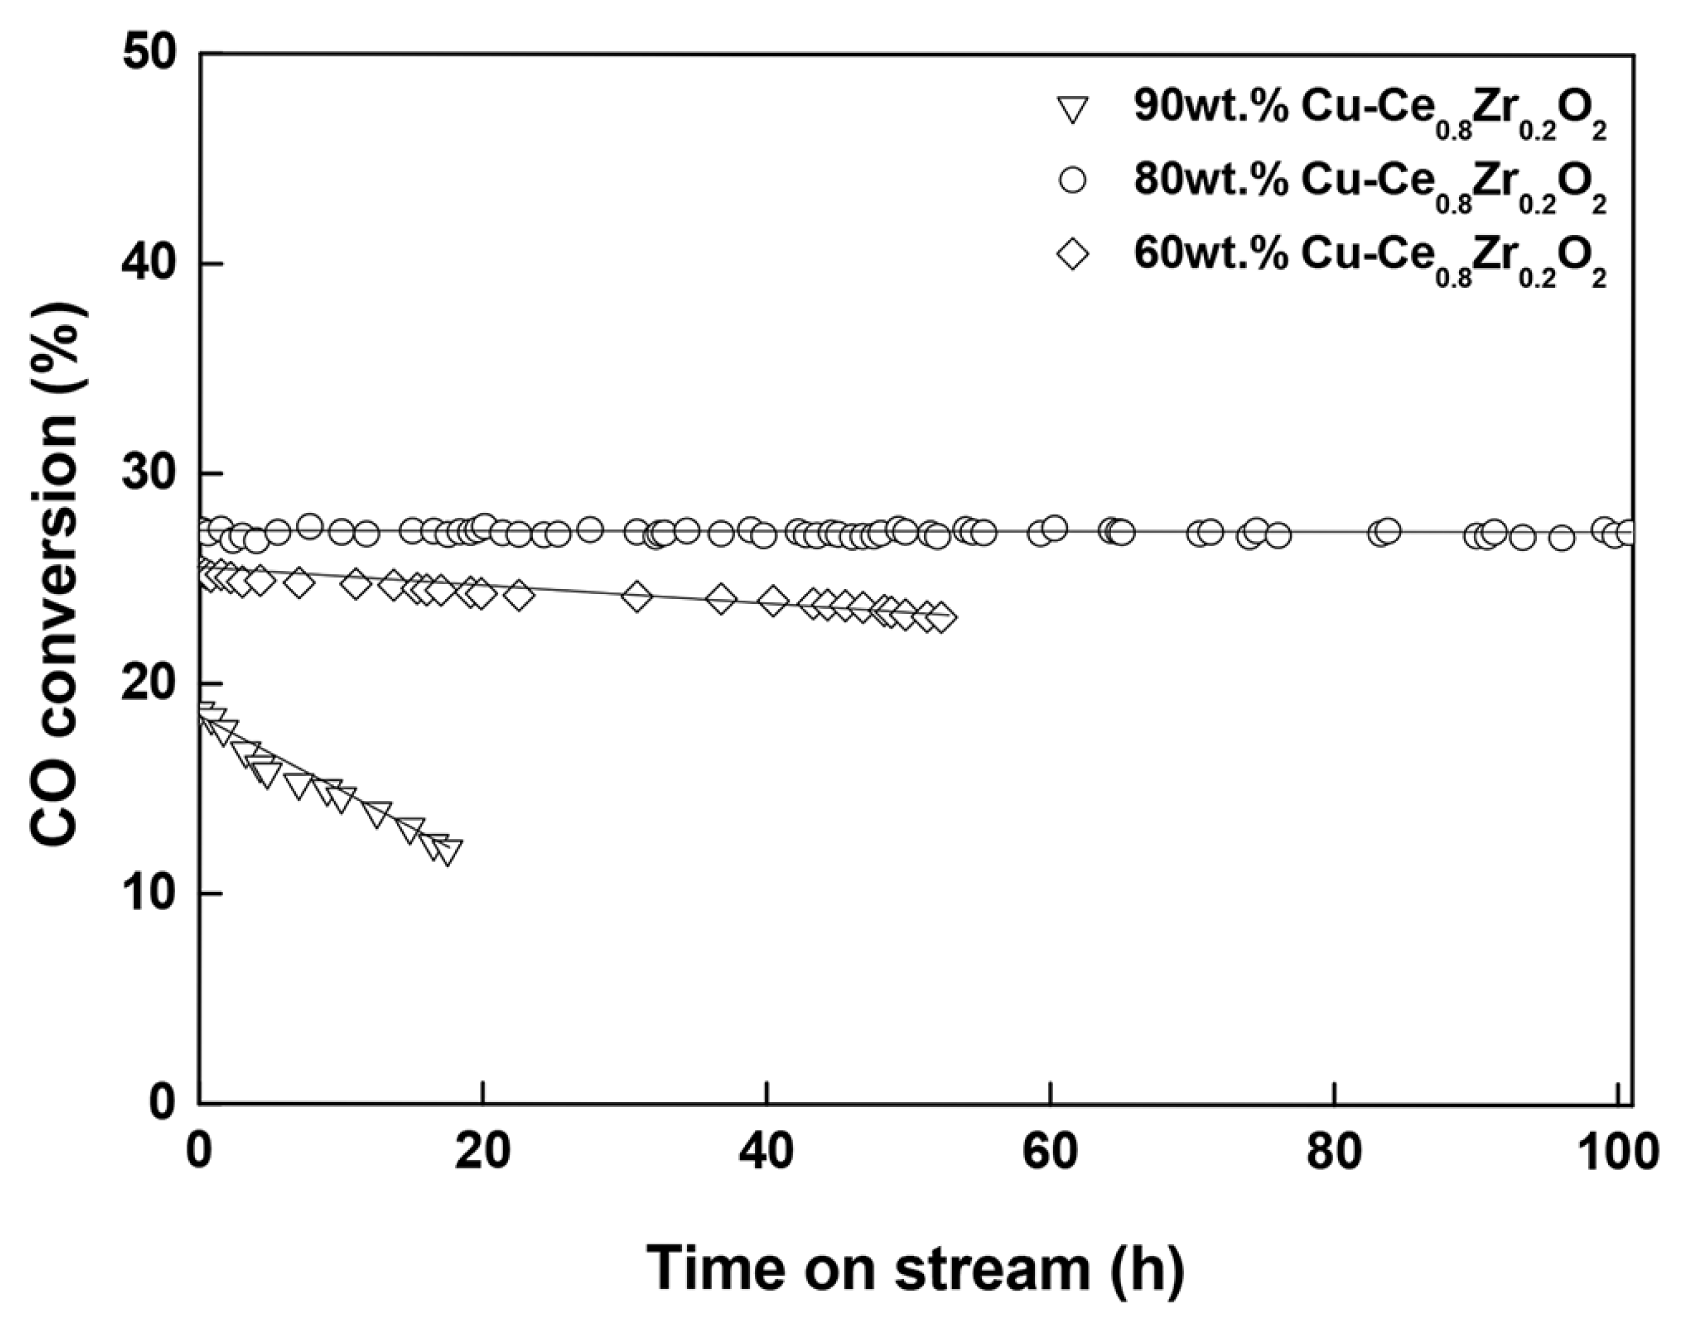
The durability of a WGS catalyst is very important for its industrial application. Therefore, to assess the stability of the optimized catalyst (80 wt% Cu-Ce0.8Zr0.2O2), a long-term WGS reaction test was performed at 270°C and at a high GHSV of 150,494 h−1 for 100 h (Fig. 6). Interestingly, the 80 wt% Cu-Ce0.8Zr0.2O2 catalyst exhibits considerably stable catalytic performance, and detectable deactivation of the catalyst was not observed (XCO > 27% at 270°C for 50 h). Thus, the 80 wt% Cu-Ce0.8Zr0.2O2 catalyst exhibits both highest WGS activity and stable CO conversion, which is attributed to the strong interaction between CuO and the support. This result clearly demonstrates that 80 wt% Cu is the optimum loading for the Ce0.8Zr0.2O2 support both in terms of activity and stability.
The excellent catalytic performance of the Cu-Ce0.8Zr0.2O2 catalyst can be explained as follows: First, the number of surface Cu atoms is an important factor for the WGS reaction. N2O-dispersion results show that the number of surface Cu atoms in the 80 wt% Cu-Ce0.8Zr0.2O2 catalyst is the highest among the prepared catalysts. The abundance of surface Cu atoms in the catalyst is an important factor for metal dispersion and the stability against sintering of the Cu nanoparticles on the support. Furthermore, an increase in the number of surface Cu atoms helps to improve oxygen mobility at the surface of the support. As a result, the 80 wt% Cu-Ce0.8Zr0.2O2 catalyst exhibits the highest surface Cu atoms and the lowest activation energy in the single-stage WGS reaction.
In addition, this excellent catalytic performance (XCO and stability) can be explained with the reduction patterns obtained by TPR. The 80 wt% Cu-Ce0.8Zr0.2O2 catalyst reduces at 270°C, which is the highest reduction temperature observed in the TPR profiles of the investigated catalysts. The strong interaction between CuO and Ce0.8Zr0.2O2 catalyst is probably responsible for this catalyst exhibiting the highest thermal stability among the prepared catalysts. As a result, the 80 wt% Cu-Ce0.8Zr0.2O2 catalyst exhibits high activity with good stability, even at the extremely high GHSV of 150,494 h−1.
4. Conclusions
Among the catalysts prepared in this study, the 80 wt% Cu-Ce0.8Zr0.2O2 catalyst exhibits the highest CO conversion in the temperature range from 200°C to 400°C at a GHSV of 150,494 h−1. In addition, it exhibits stable activity at 240°C for 100 h. The excellent catalytic performance of this catalyst is primarily because of the high abundance of surface Cu atoms and the low activation energy, which result from the strong interaction between CuO and Ce0.8Zr0.2O2 support. As a result, the 80 wt% Cu-Ce0.8Zr0.2O2 catalyst exhibits stronger resistance against Cu sintering. Therefore, 80 wt% is the optimal Cu loading for the co-precipitated Cu-Ce0.8Zr0.2O2 catalysts for the low-temperature WGS reaction.


